Contents
- One Server, Your Data Stays With You
- Installation With One Command
- Dashboard: What You See After Logging In
- Where the Data Comes From
- Where the Data Is Stored
- Log Explorer: Searching Events
- Network Traffic Analysis
- Detection: How Data Becomes an Alert
- Event Center: Everything in One Place
- Notifications and Response
- What Higher Licenses Add
- How to Get Started
FlowPro NG has grown into a fairly large system: it collects logs from servers and network devices, analyzes network traffic, looks for vulnerabilities and tracks NIS2 compliance. People who see it for the first time often ask how the parts fit together. This article follows the basic path of the data: where it comes from, where it is stored, how it turns into an alert and how that alert reaches you.
All screenshots come from our development instance. Host names, addresses and personal names have been replaced with fictitious ones.
One Server, Your Data Stays With You
FlowPro NG does not run in the cloud. The whole system installs on one of your own servers with Ubuntu 26.04 LTS or 24.04 LTS, physical or virtual. The databases, collectors and web interface run together, and neither your logs nor information about your network traffic leave your infrastructure. The system only goes to the internet for updates, license checks and central data sources such as the CVE database or lists of malicious addresses.
The path of the data comes down to five steps:
- Collection: agents on servers and workstations, syslog from network devices and NetFlow from routers.
- Storage: logs in Elasticsearch, network flows in ClickHouse, configuration in PostgreSQL.
- Detection: rules, network anomaly analysis, Suricata IDS, threat intelligence and other modules.
- Event Center: every alert in one place, with priority and handling status.
- Response: notifications by e-mail or chat, or an automated playbook.
Let's go through them one by one.
Installation With One Command
On a clean Ubuntu server, run the installation script and then the setup wizard:
curl -fsSL https://repo.net-service.io/flowpro/install.sh | sudo bash
sudo flowpro-setup
The script adds the repository and installs the packages. The wizard asks for the domain, time zone, Let's Encrypt certificate and administrator credentials, and sets up everything else on its own. For a trial, 16 GB of RAM and a 100 GB SSD are enough. For production we recommend 32 GB of RAM or more and fast NVMe disks, because Elasticsearch needs the most memory and disk performance.
Dashboard: What You See After Logging In
The first screen is the Dashboard. It shows the number of events today, active alerts, device status, a chart of events over the last 24 hours, the split by data source and the health of the server itself (memory, disk, CPU). At the top is the security score, a number from 0 to 100 that sums up the individual areas of your security, with advice on what to improve first.
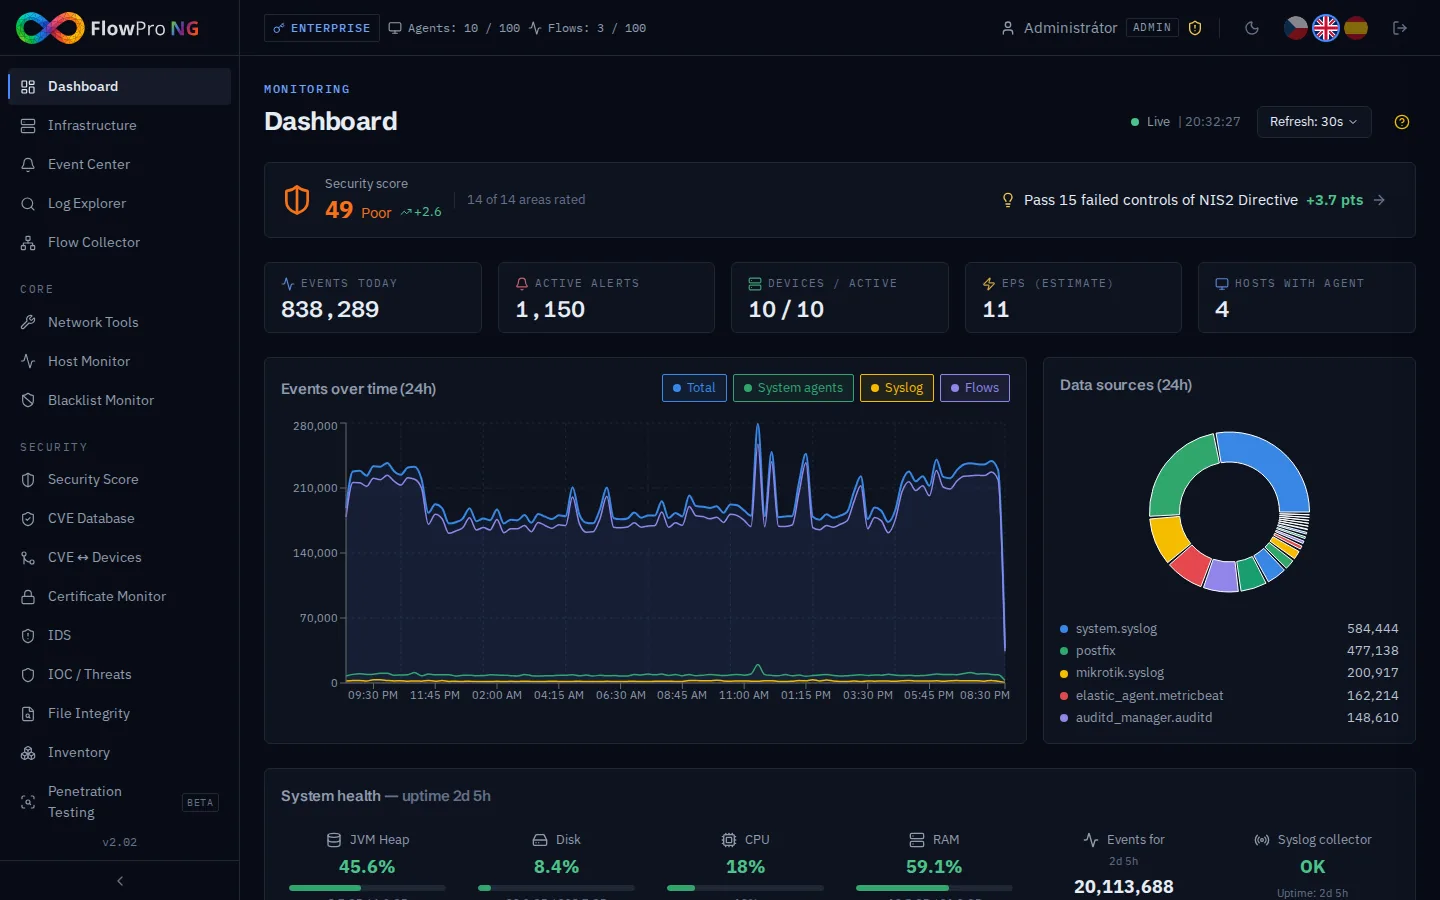
Right after installation the dashboard is empty. The system has nothing to work with yet, so the first task is to connect data sources.
Where the Data Comes From
FlowPro NG receives data in three ways. They can run at the same time, and most deployments use all three.
System Agents on Servers and Workstations
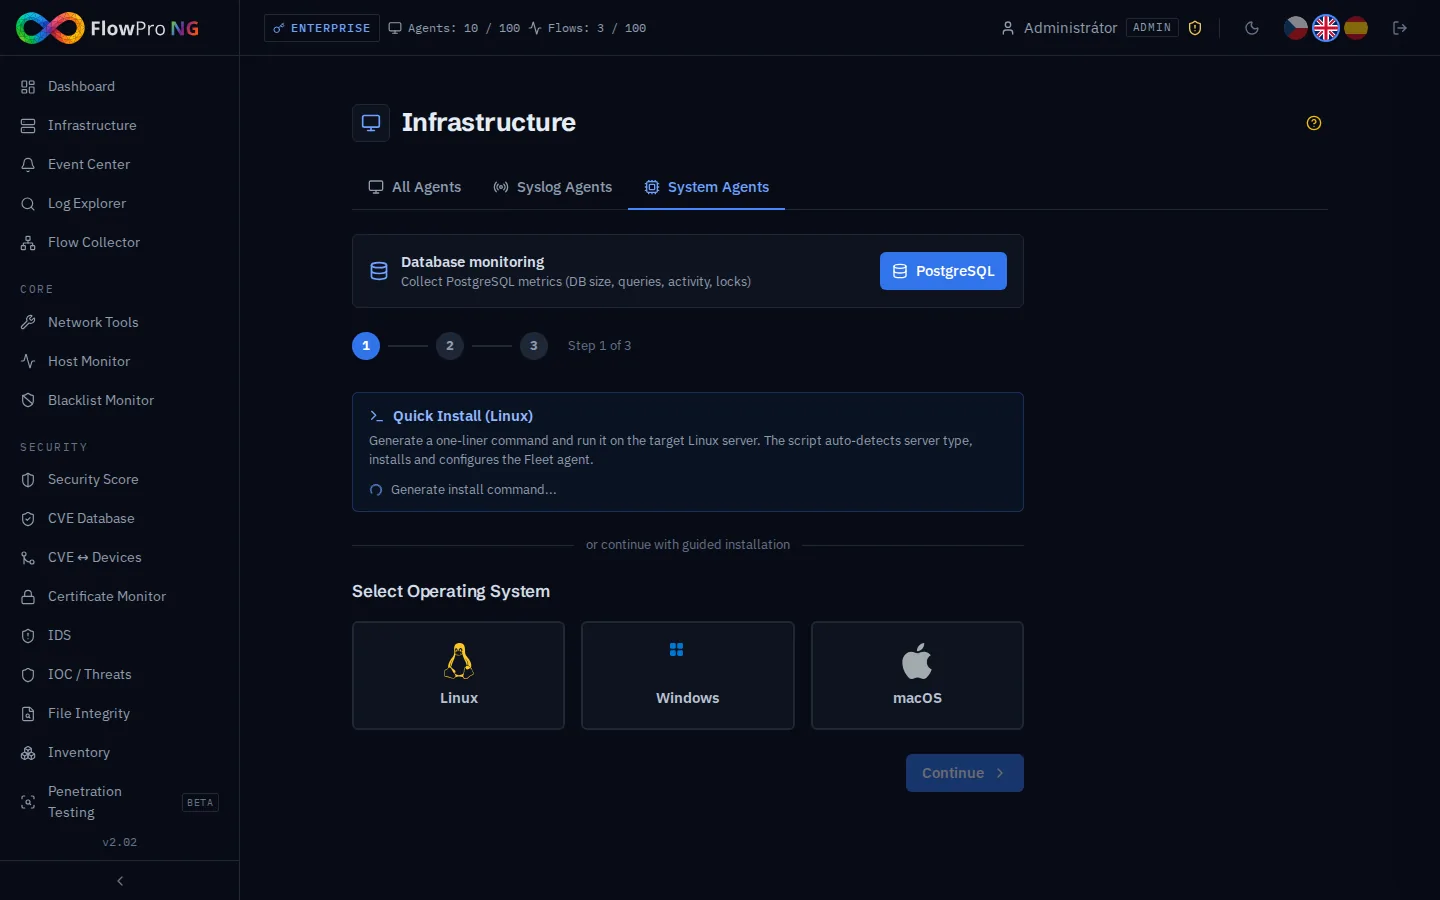
Servers and workstations running Linux, Windows or macOS get an Elastic Agent. It collects system logs, security events, metrics (CPU, memory, disk, network) and, depending on the settings, file changes or an inventory of installed software. The agents are managed by a Fleet Server that runs on the FlowPro NG server itself, so their settings change centrally and you do not have to visit each machine.
Installation starts in Infrastructure → System Agents. For Linux, FlowPro NG generates a one-line command that you run on the target server. The script detects the server type, installs the agent and connects it. For Windows and macOS a wizard guides you step by step.
Syslog From Network Devices
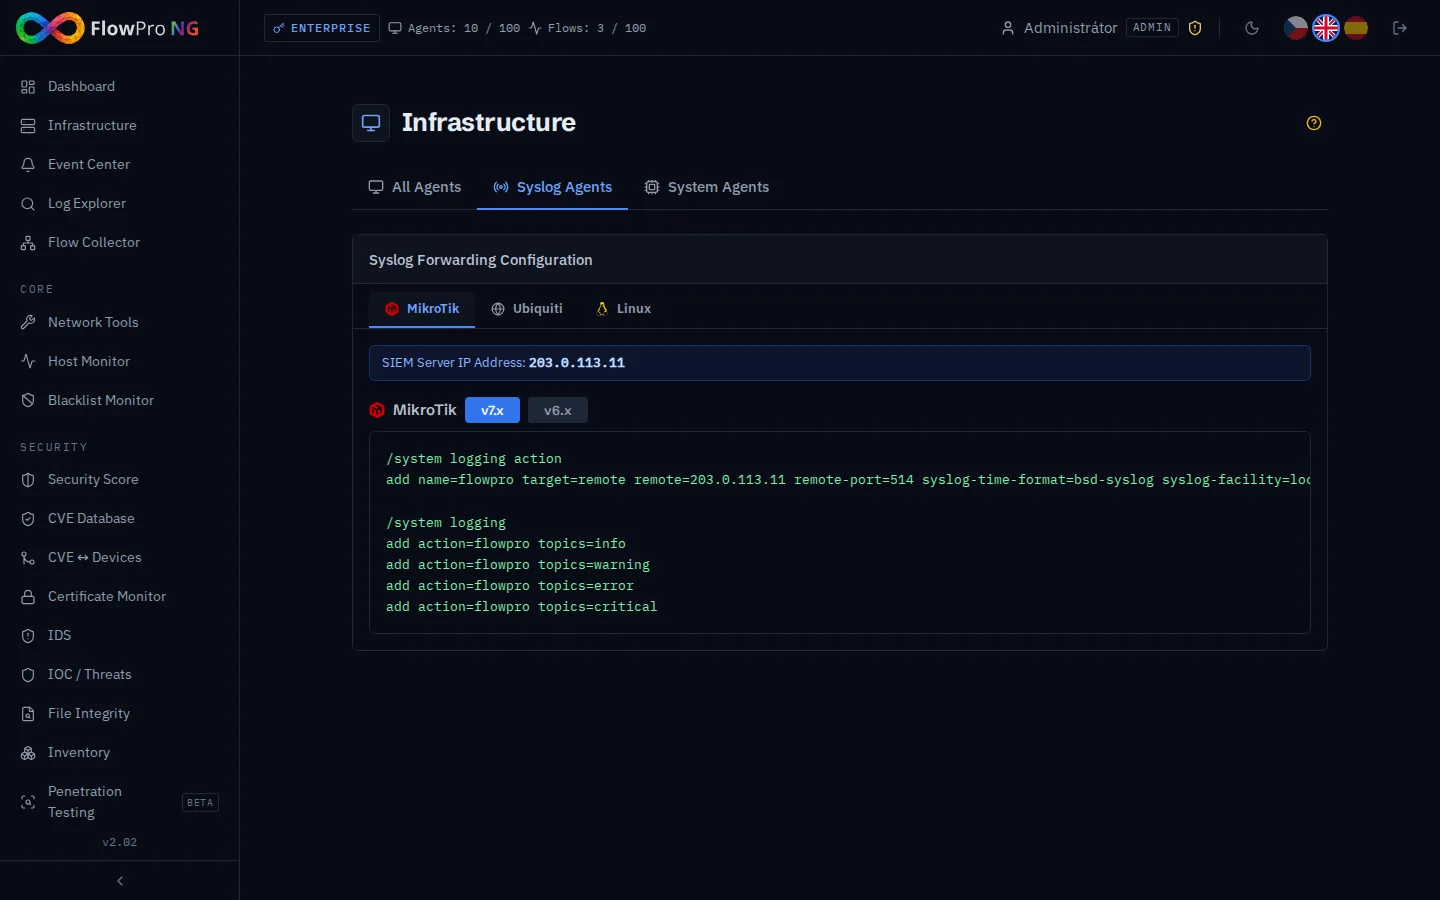
Routers, switches, firewalls and access points usually send their logs over syslog. FlowPro NG receives them on UDP port 514, recognizes the device format and stores them like any other logs. For MikroTik, Ubiquiti and Linux you will find a ready-made configuration in Infrastructure → Syslog Agents, with your server's address already filled in.
NetFlow From Routers
Logs tell you what happened on a device. NetFlow (or IPFIX) tells you who talked to whom on the network: source and destination address, ports, protocol and the amount of data. The router sends these summaries to UDP port 12051, and FlowPro NG turns them into traffic statistics and looks for anomalies. Most routers can export NetFlow (MikroTik calls it Traffic Flow), and on Linux servers a tool such as softflowd does the job.
Infrastructure: Every Source in One Place
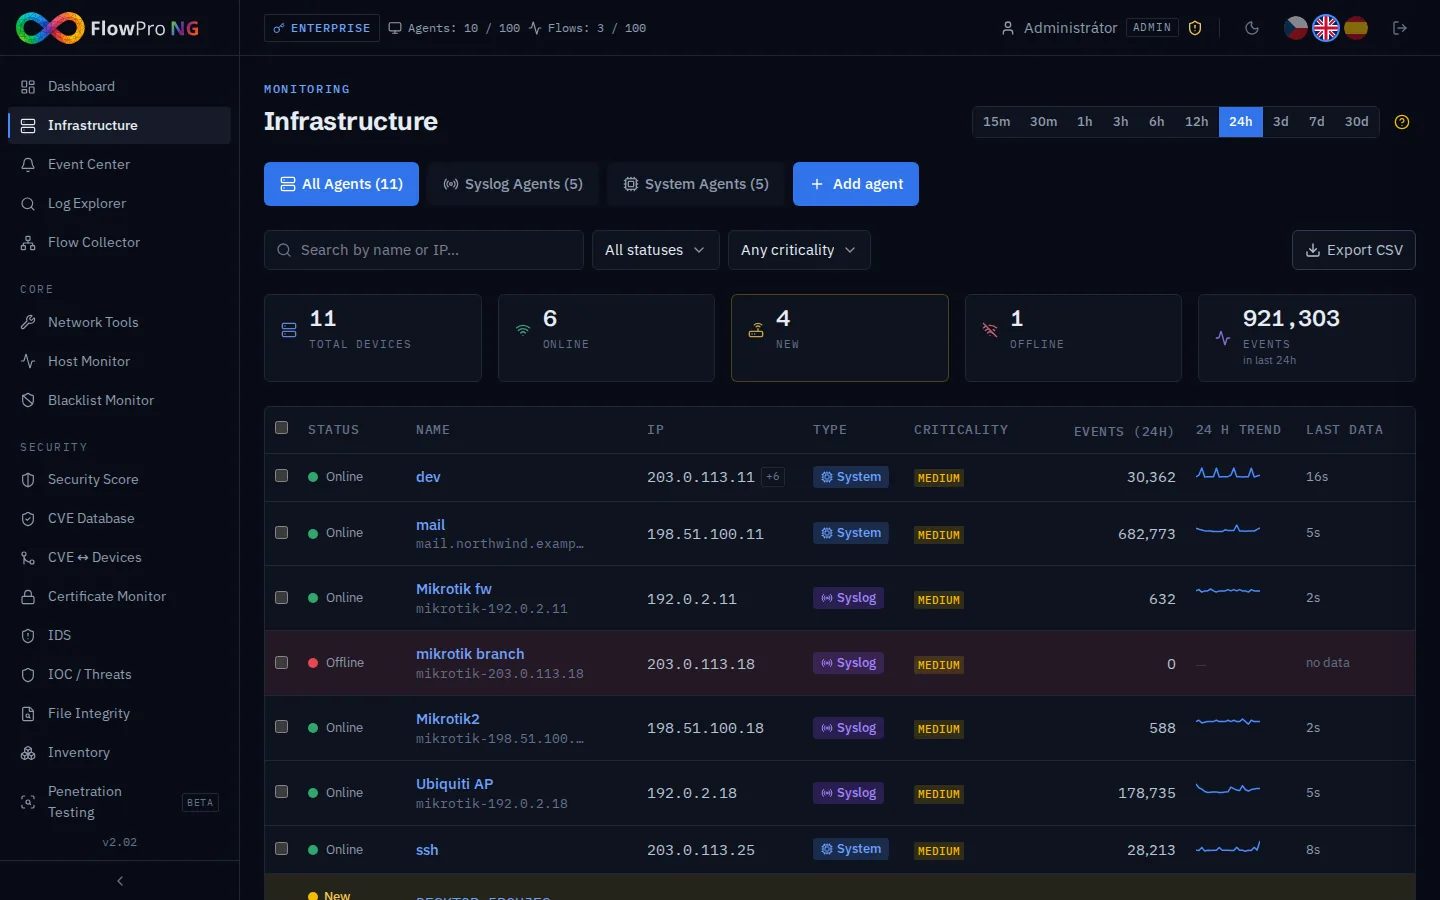
Every connected agent, syslog device and NetFlow source appears in Infrastructure. For each one you see the status (online, offline), address, source type, criticality and the number of events in the last 24 hours. A device that starts sending data before it is registered shows up in yellow as new. One click adds it to your inventory.
Where the Data Is Stored
Each kind of data has its own database, because each is used differently:
| Data | Database | Why |
|---|---|---|
| Logs and security events | Elasticsearch | fast full-text search across hundreds of millions of records |
| Network flows (NetFlow, IPFIX) | ClickHouse | analytical queries over billions of flows in seconds |
| Configuration, users, inventory | PostgreSQL | a reliable relational database for data that changes |
How long the data is kept is set in Settings → Databases → Data Retention, separately for ten categories (syslog, IDS, metrics, network flows and others). The upper limit comes from the license: 30 days in the free version, 6 months in Core, one year in Security and unlimited in Enterprise.
Log Explorer: Searching Events
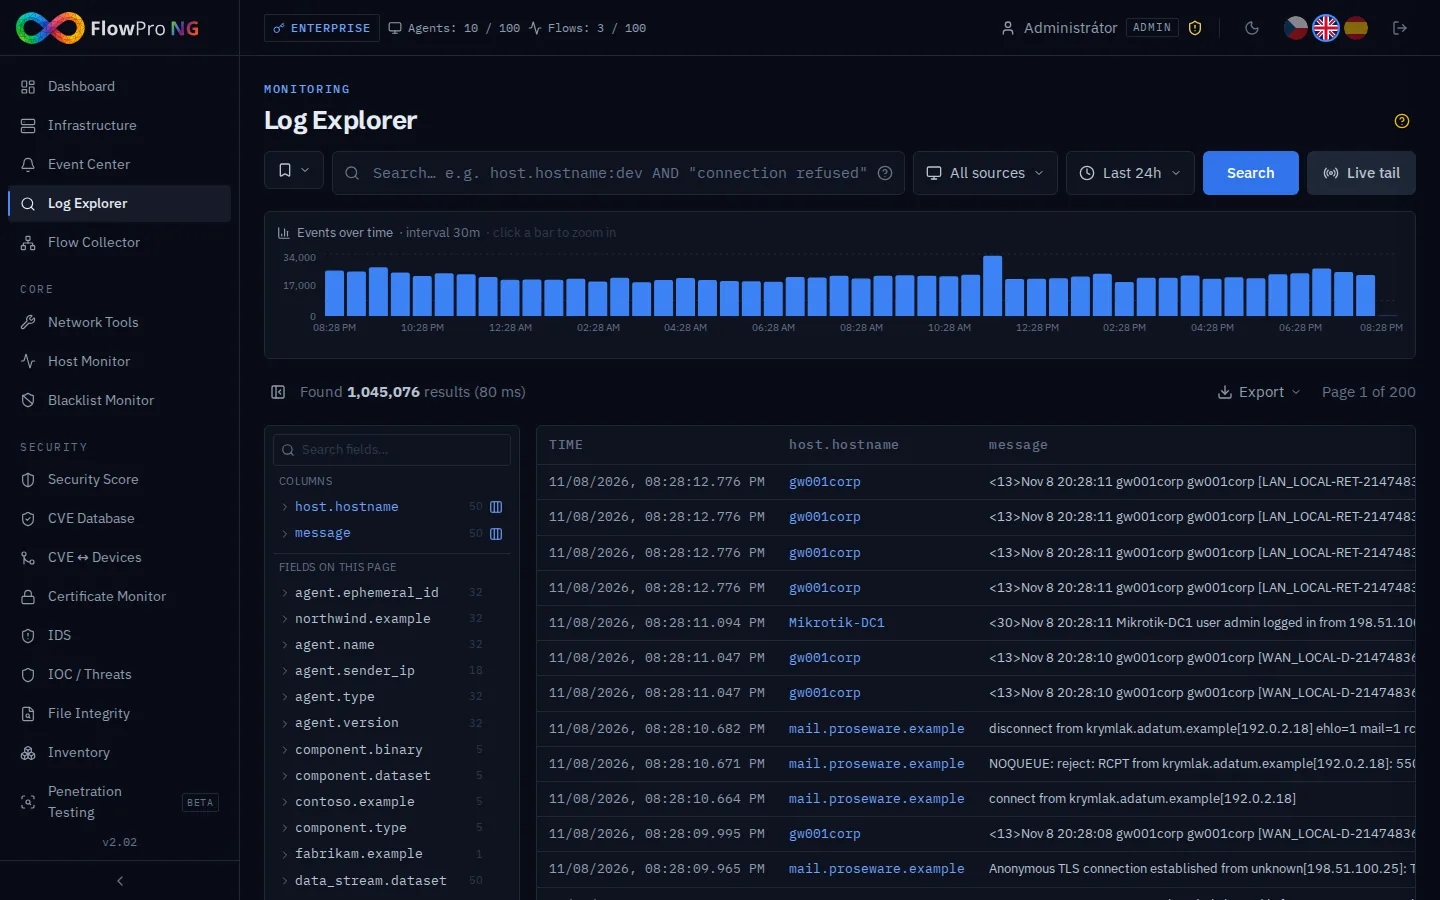
When you need to find out what happened on a server or router, open the Log Explorer. It works much like a search engine: you type a query (for example a host name and a piece of the message), choose a time range and see a chart of the number of events over time above the results. Clicking a field in the left panel narrows the results further. Results can be exported, and a live view follows new events in real time.
Network Traffic Analysis
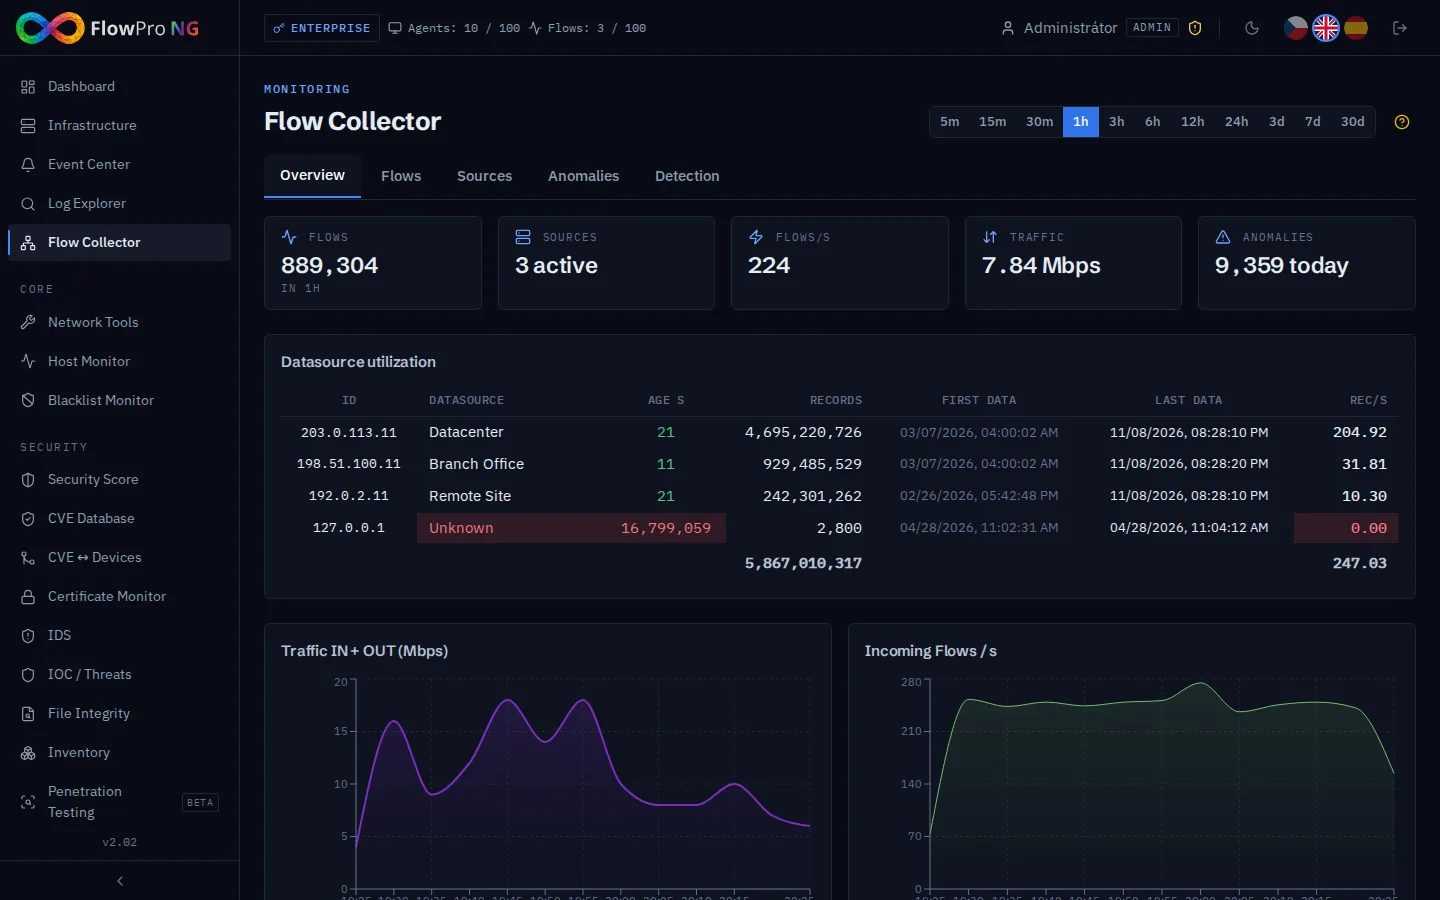
NetFlow data is processed by the Flow Collector. Its overview shows current traffic in Mbps, flows per second, the load of each source and traffic charts over time.
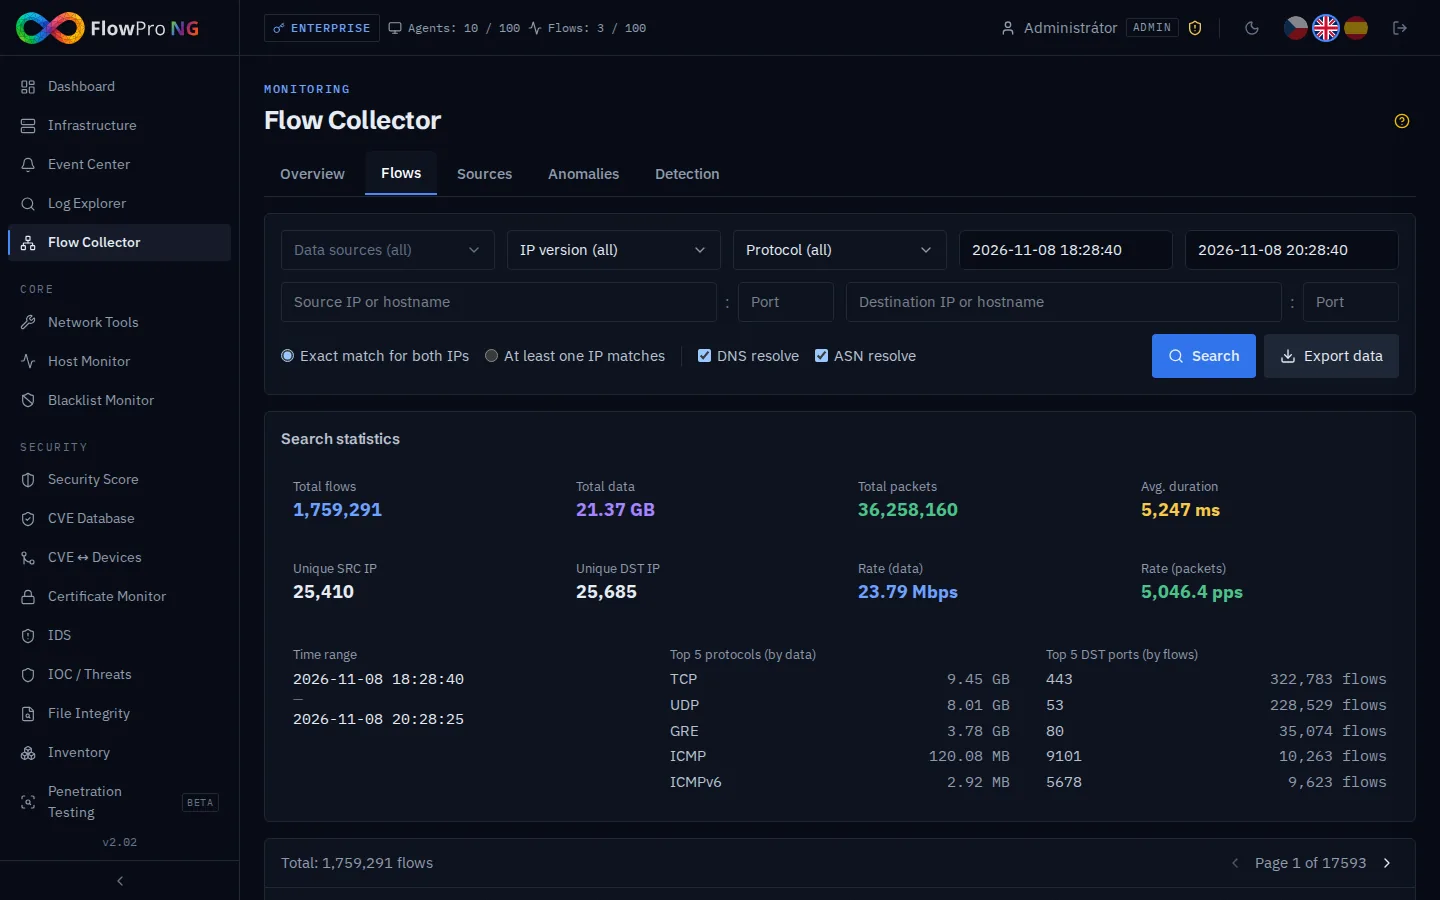
The Flows tab lets you find specific communication, for example every connection of one address in the last hour, with DNS names, autonomous system numbers and protocol and port statistics.
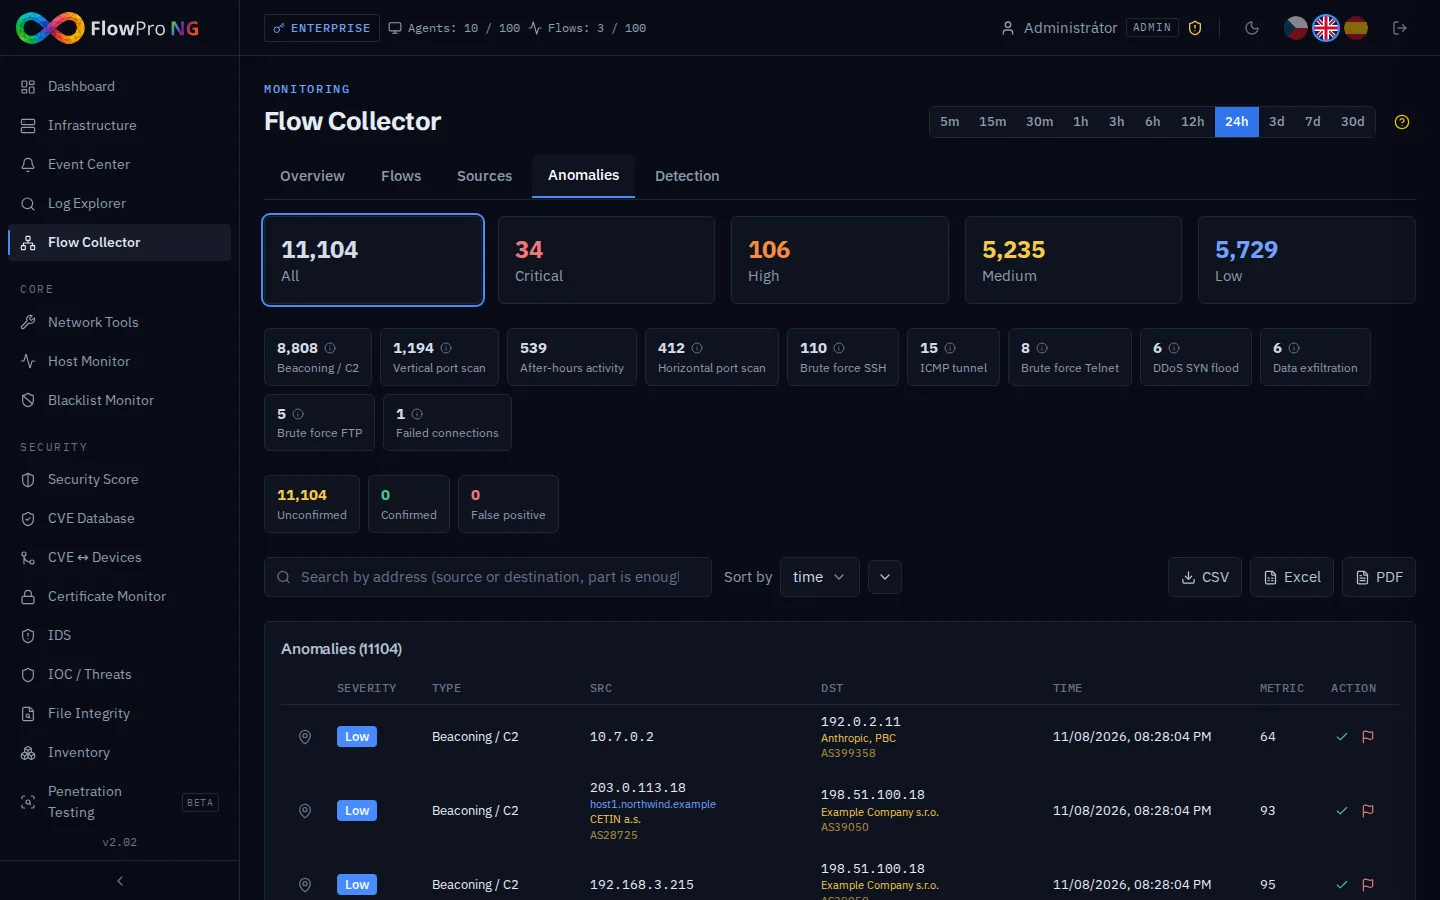
The Anomalies tab holds the results of automatic detection, which goes through new flows every minute and looks for more than fifteen kinds of suspicious behavior: port scans, brute-force attacks on SSH, RDP or Telnet, command-and-control communication (beaconing), tunneling over DNS or ICMP, data exfiltration, SYN floods or activity outside working hours.
There is more on this in NetFlow analysis and Network anomaly detection.
Detection: How Data Becomes an Alert
Storing data is not enough, someone has to read it. That is the job of the detection mechanisms running in the background:
- Detection rules over logs. Ready-made packs for Linux, Windows, MikroTik, Ubiquiti and FortiGate can be enabled by category, depending on the data you have.
- Network anomaly analysis over NetFlow, described above.
- Suricata IDS inspects network traffic against thousands of attack signatures (Security license).
- Threat intelligence compares addresses and domains from your traffic with lists of known malicious sources.
- Other modules report their own findings: a new vulnerability on a device, an expiring certificate, a service that is down, an address on a blacklist, a change to an important file or an attack on the honeypot.
Event Center: Everything in One Place
Alerts from every source end up in the Event Center. At the top are the counts by severity (critical, high, medium, low) and filters by status and source. Each event has a detail view with a description, the affected addresses and devices and a link to the related logs. Events can be acknowledged, closed, commented on, marked as a false positive or handled in bulk.
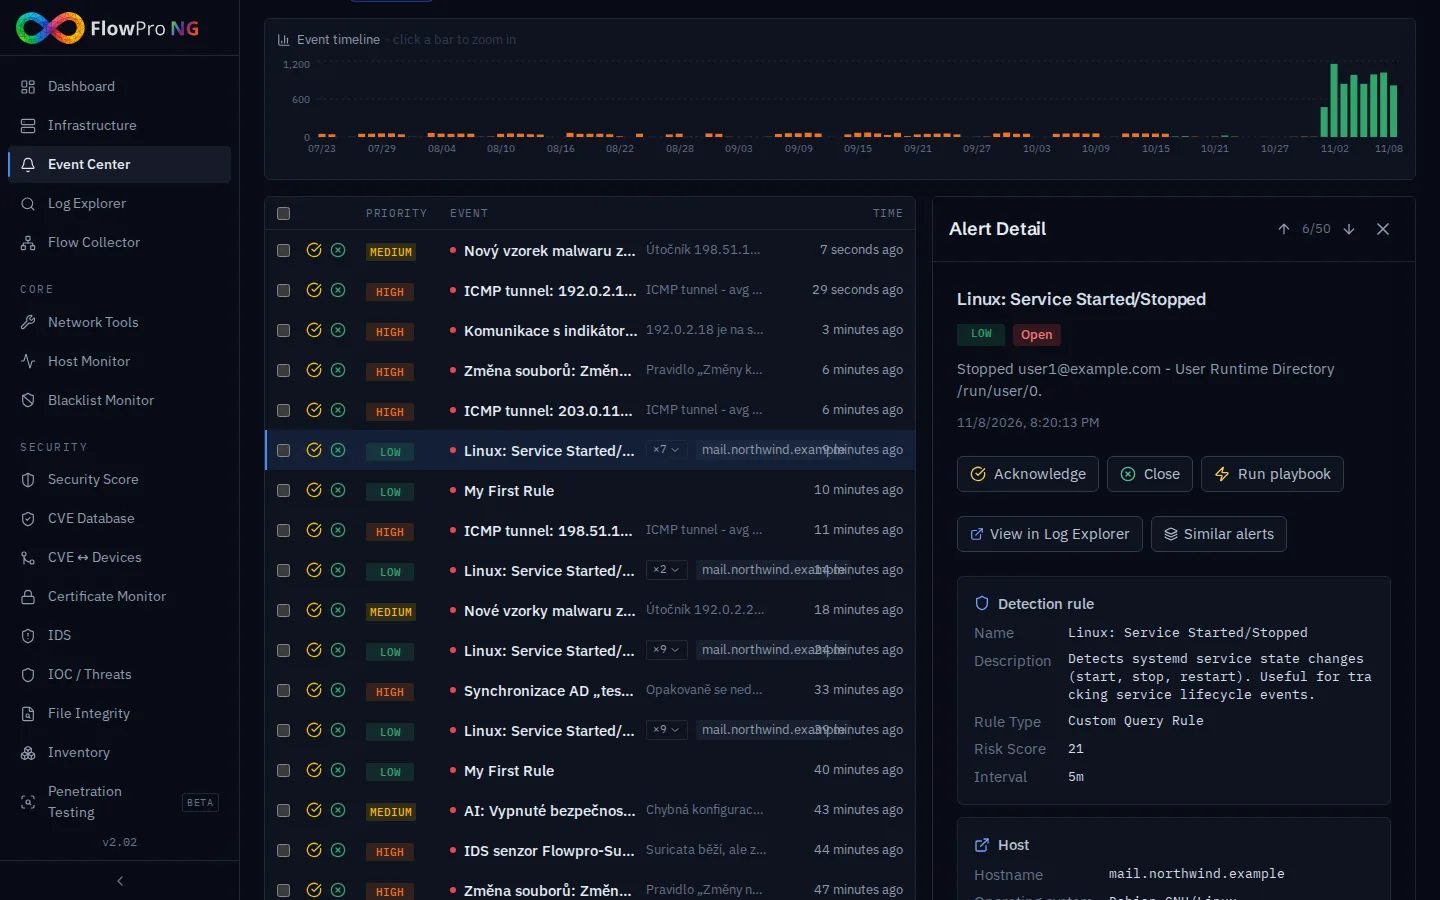
With one list you do not have to go through ten different screens. In the morning you open the Event Center, filter new critical and high alerts and work through them.
Notifications and Response
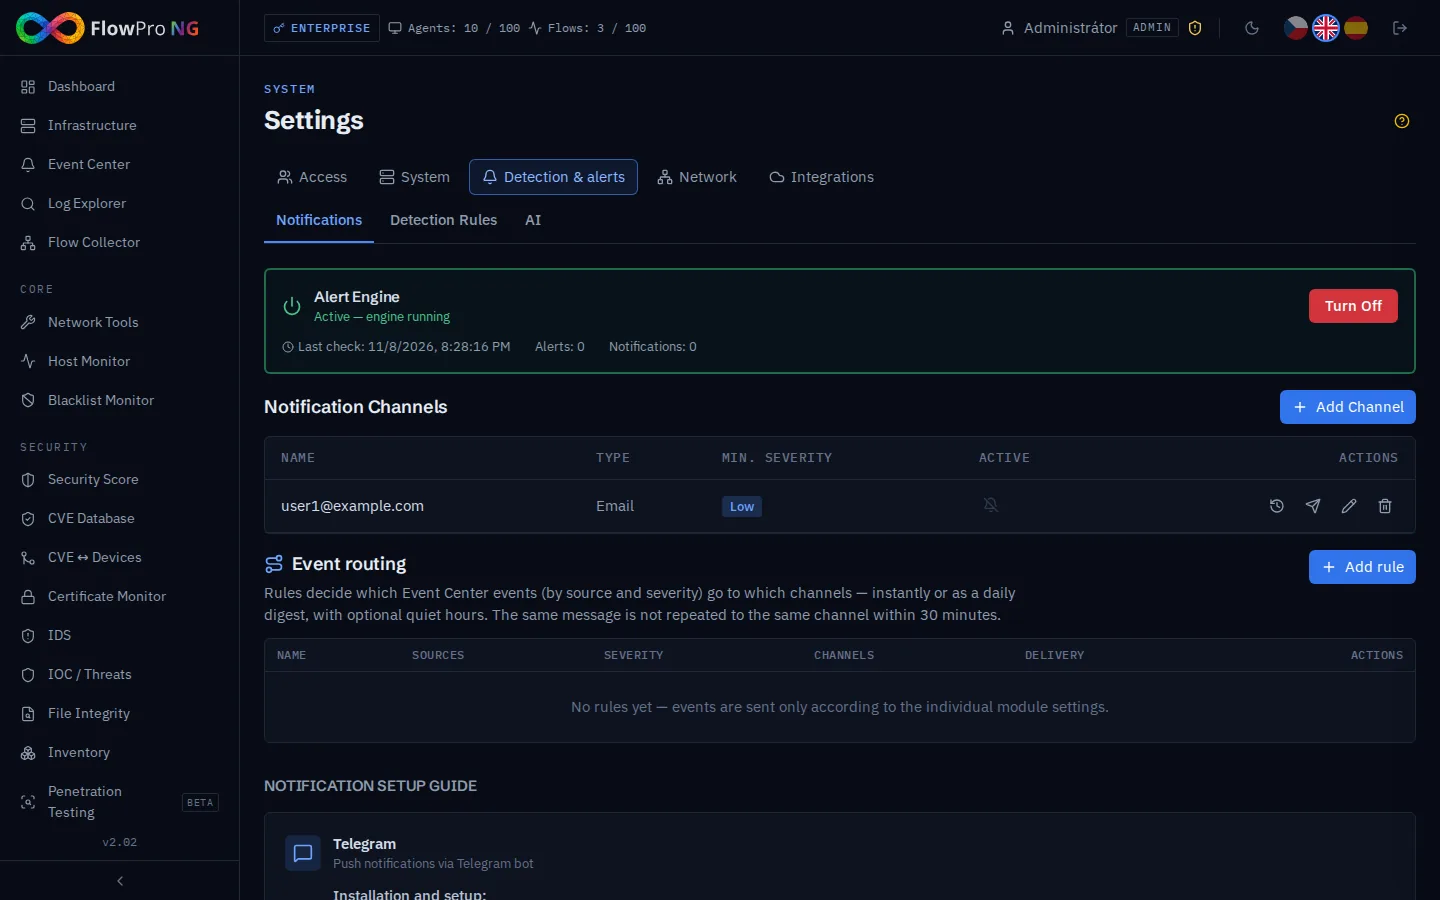
Nobody watches the screen around the clock, so FlowPro NG can pass important events on. In Settings → Notifications you add channels: e-mail, Telegram, Slack, Microsoft Teams, ntfy or a generic webhook for your own system. Routing rules then decide which events (by source and severity) go to which channel, whether immediately or as a daily digest, and whether quiet hours apply. The same message is not sent to the same channel again within 30 minutes.
With the Enterprise license, events can trigger playbooks: automated actions that, for example, block an attacking address on a MikroTik router for a set time, send a notification or call the webhook of your ticketing system. Each playbook can be tried out in test mode first.
What Higher Licenses Add
The basics described in this article, meaning log collection, Log Explorer, Event Center, Infrastructure and Flow Collector, are part of every license including the free one. Higher licenses add more modules and capacity:
| License | What it adds | Agents | NetFlow sources | Retention |
|---|---|---|---|---|
| Free | the basics: logs, events, devices, NetFlow | 5 | 1 | 30 days |
| Core | network tools, uptime monitoring, blacklist monitoring | 50 | 3 | 6 months |
| Security | IDS, CVE and vulnerabilities, certificates, threat intelligence, file integrity, security score | 200 | 10 | 1 year |
| Enterprise | MITRE ATT&CK, honeypot, passive DNS, playbooks, Active Directory | unlimited | unlimited | unlimited |
See the pricing and modules pages for a full comparison.
How to Get Started
- Prepare a server with Ubuntu 26.04 LTS or 24.04 LTS (a virtual machine is fine).
- Install FlowPro NG and start the 14-day trial.
- Connect your first sources: an agent on one server, syslog from your main router and NetFlow.
- Set up at least one notification channel so nothing important slips past you.
- After a few days, go through the Event Center and the security score and enable more modules based on the recommendations.
If you would rather look around first, try the online demo with sample data. In the next articles we will look at individual modules in detail: intrusion detection, vulnerability management and preparing for a NIS2 audit.
- SIEM
- NetFlow
- Elastic Agent
- Syslog
- Suricata