Contents
Logs tell you what happened on a particular device. They do not tell you who talked to whom on the network, how much data they moved and when. That is what NetFlow is for: a router or another device summarizes traffic into flows and sends them to a collector. FlowPro NG turns them into traffic statistics, looks for anomalies and lets you trace a specific connection even weeks later.
This guide shows how to send flows from the three most common sources: a MikroTik router, a Linux server or router, and a switch. At the end you will find how to check that the data arrives and what FlowPro NG does with it next.
How Flow Collection Works
A flow is a summary of packets with the same source and destination address, ports and protocol. The device, called an exporter in this role, keeps track of flows and sends finished records over UDP to the FlowPro NG server. A record holds the addresses, ports, protocol, number of bytes and packets, start and end time, TCP flags and the input and output interface. If the exporter supports it, it also sends MAC addresses and addresses after NAT translation.
The content of the communication is not transferred. NetFlow therefore works for encrypted traffic too, and the amount of data is a fraction of the traffic itself.
FlowPro NG receives NetFlow v5, v9 and IPFIX on UDP port 12051. Each address that sends flows is one source. A new source shows up on its own, nothing has to be registered in advance.
Before You Start
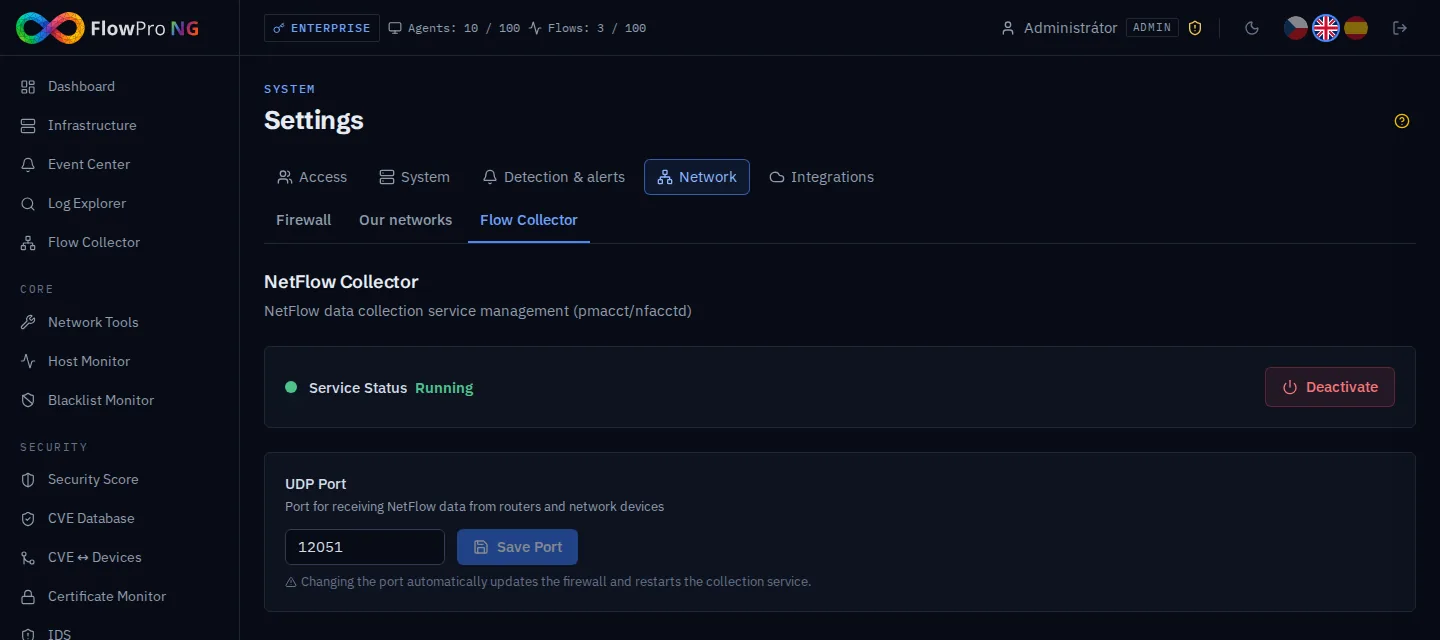
Collector port and status. The port and service status are in Settings → Network → Flow Collector. The default port is 12051. If you change it, FlowPro NG updates the server firewall and restarts the collection service on its own.
Network path. Any firewall between the exporter and the server must allow UDP to port 12051 towards the server. NetFlow is sent unencrypted, so route it over your internal network or a VPN, not across the public internet.
Version. If the device supports v9 or IPFIX, do not use v5. The older version carries no IPv6, VLANs or MAC addresses.
Active timeout. A long connection, such as a download or a video call, is exported in parts each time the active timeout expires. We recommend 1 minute, otherwise the traffic shows up in the charts late and all at once.
License. The number of flow sources depends on the license: 1 in the free version, 3 in Core, 10 in Security and unlimited in Enterprise. Each exporter address counts as one source.
In the examples below the FlowPro NG server address is 192.0.2.10. Replace it with your own.
MikroTik (RouterOS)
MikroTik routers have flow export built in under the name Traffic Flow. In WinBox you will find it in IP → Traffic Flow. From the terminal you turn it on with two commands that work in RouterOS v6 and v7:
/ip traffic-flow set enabled=yes interfaces=all active-flow-timeout=1m inactive-flow-timeout=15s
/ip traffic-flow target add dst-address=192.0.2.10 port=12051 version=9
For IPFIX instead of NetFlow v9, use version=ipfix. You can check the settings like this:
/ip traffic-flow print
/ip traffic-flow target print
The default active timeout on MikroTik is 30 minutes, which is why the first command shortens it to 1 minute. The router sends flows from the address of the interface on the route to the server, and that address is what appears as the source.
Linux (softflowd)
Linux has no built-in flow export. A small daemon called softflowd takes care of it: it watches traffic on a chosen interface and sends NetFlow from it. It is useful in three situations:
- a Linux router or firewall sees all traffic to and from the internet,
- a standalone server sees only its own communication, which is enough for a web or mail server, for example,
- a probe on a mirrored switch port, described in the next section.
On Ubuntu and Debian, install softflowd from the standard repository:
sudo apt install softflowdThe settings are in the file /etc/softflowd/default.conf:
interface='eth0'
options='-n 192.0.2.10:12051 -v 9 -t maxlife=60'
interface is the interface you want to watch. ip link lists the interfaces. -n sets the collector address and port, -v 9 selects NetFlow v9 (-v 10 is IPFIX) and -t maxlife=60 sets the active timeout to 60 seconds. On a router, pick one interface, for example the one facing the internet. If you watched all interfaces, a routed flow would be counted twice.
Then enable the service and check that it is sending data:
sudo systemctl enable --now softflowd@default
sudo softflowctl -c /run/softflowd/default.ctl statisticsSwitches
With a switch there are two ways, depending on what it supports.
The Switch Exports Flows Itself
Higher-end managed L3 switches support NetFlow or IPFIX directly, for example Cisco Catalyst with Flexible NetFlow. The configuration differs by vendor, but you always set the same things: the FlowPro NG server address, port 12051, version 9 or IPFIX and an active timeout of about 60 seconds. Look for NetFlow, IPFIX or Flow export in the switch documentation.
Port Mirroring and Linux With softflowd
Most switches cannot do NetFlow, but they can do port mirroring (SPAN). The switch sends a copy of all traffic from a chosen port to another port. There you connect a Linux machine running softflowd, which builds flows from the copy. This works with any managed switch and also gives you visibility into traffic inside your network.
The port worth mirroring is usually the uplink to the router, or the port with your important servers. An example for Cisco IOS that mirrors port 1 to port 24:
monitor session 1 source interface GigabitEthernet1/0/1 both
monitor session 1 destination interface GigabitEthernet1/0/24
And the same for a MikroTik CRS3xx series switch:
/interface ethernet switch set switch1 mirror-source=ether1 mirror-target=ether24On the Linux machine, connect the mirrored port to a separate network card. The card needs no IP address, it only has to be up (sudo ip link set eth1 up). Then set interface='eth1' in /etc/softflowd/default.conf; the rest is the same as in the previous section. The flows go to FlowPro NG through the second network card, which connects the machine to the network as usual.
Connect a switch that only sends sFlow the same way, through port mirroring. The FlowPro NG collector receives NetFlow and IPFIX.
Checking That Data Arrives
Within a minute of configuring the exporter, its address appears in the Flow Collector on the Sources tab. You see when the source first and last sent data, how many records have arrived and how many arrive per second. The bar at the top shows the number of sources against the license limit. The pencil icon lets you name the source, so you see something like "Main router" everywhere instead of the address.
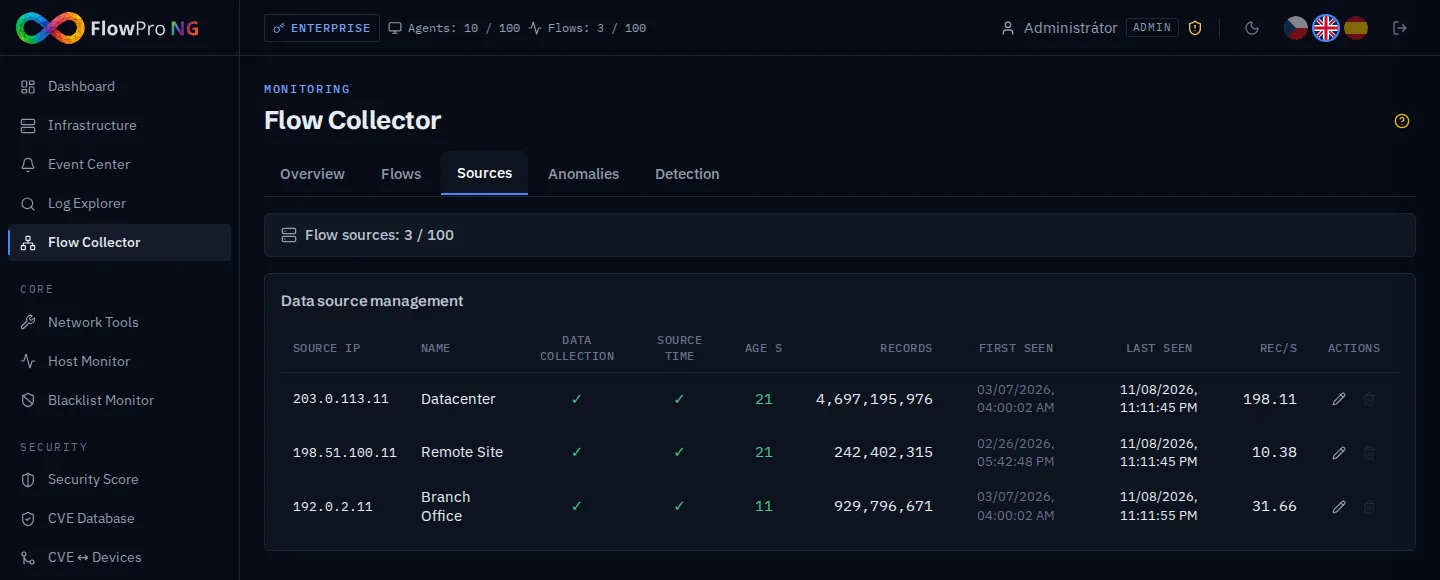
If the source does not appear, go through these points:
- In Settings → Network → Flow Collector the service status must be "Running".
- On the server, check that the packets arrive at all:
sudo tcpdump -ni any udp port 12051 -c 10. If nothing comes in, the problem is in the network or on the exporter, typically a firewall on the way or a wrong destination address. - Packets arrive but the source is missing? Check the version on the exporter (v5, v9 or IPFIX) and the source limit of your license. A source over the limit is marked as blocked on the Sources tab.
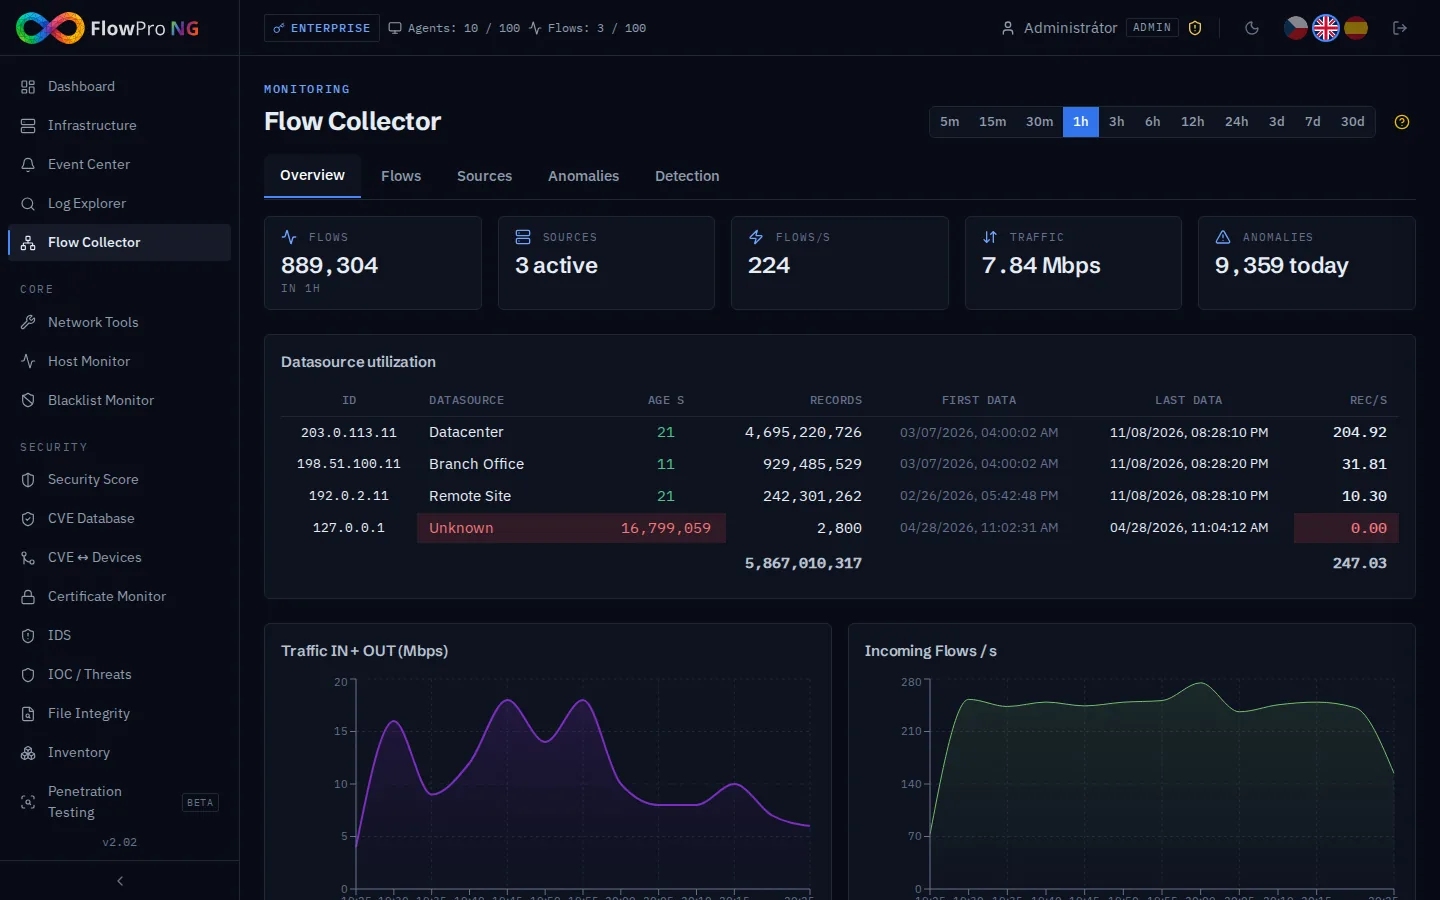
Once data flows, the Flow Collector Overview shows current traffic, flows and packets per second, the split by protocol, a country map and the most active addresses. Click a source to see the overview for that source only.
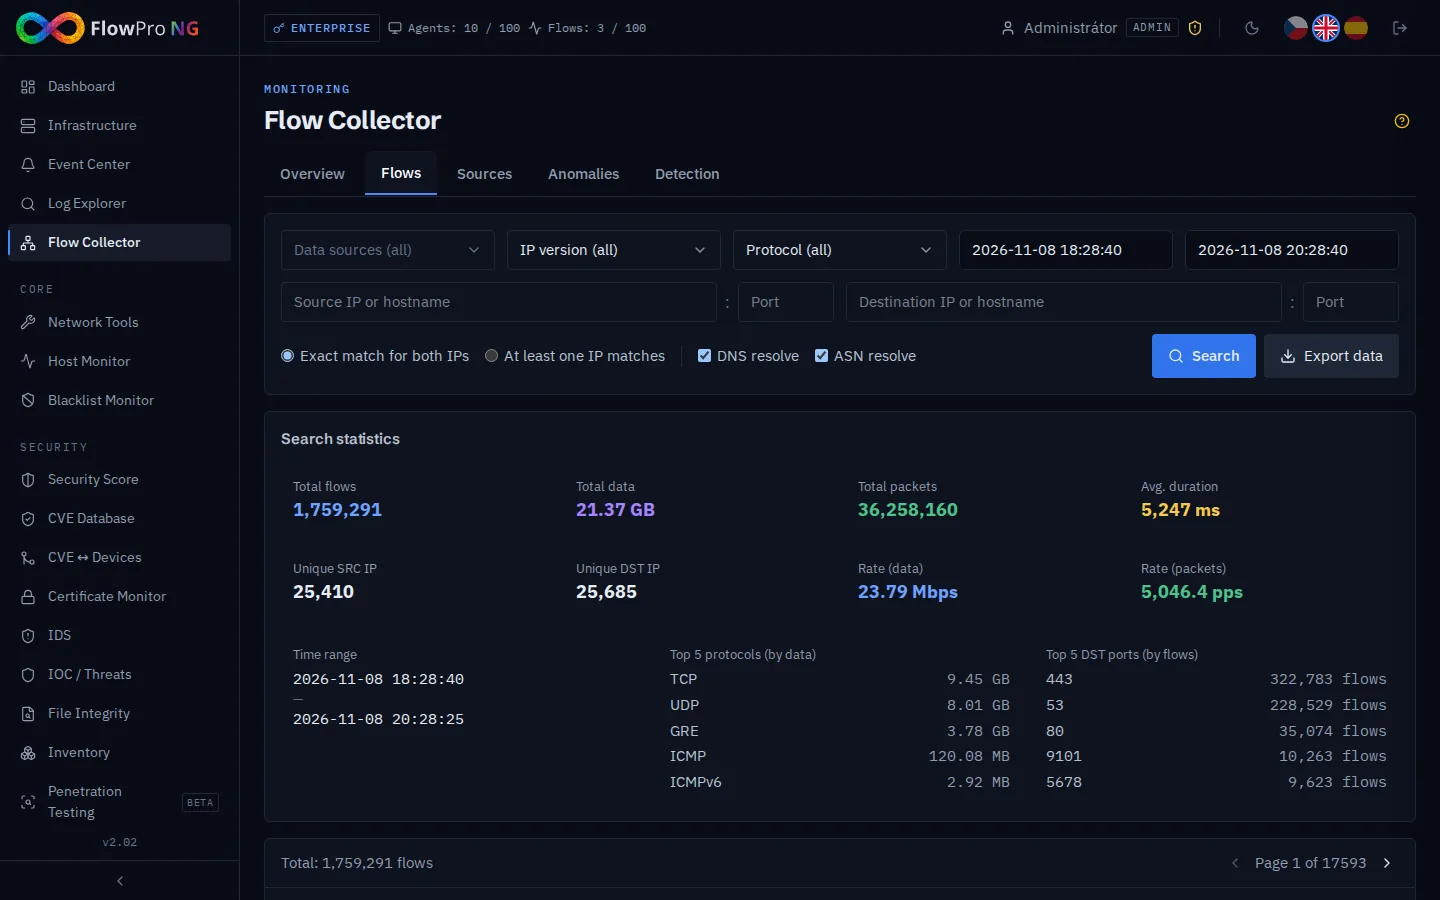
On the Flows tab you can find specific communication by address, CIDR range, port, protocol or source. Results can be exported to CSV, Excel or PDF.
What FlowPro NG Does With the Flows
Every minute, 17 anomaly detections go through the new flows: port scans, brute-force attacks on SSH, RDP or FTP, beaconing and command-and-control traffic, tunneling over DNS or ICMP, data exfiltration, flood attacks or activity outside working hours. On the Detection tab you can turn each detection off, adjust its thresholds for medium, high and critical severity and see how many findings it produced in the last week.
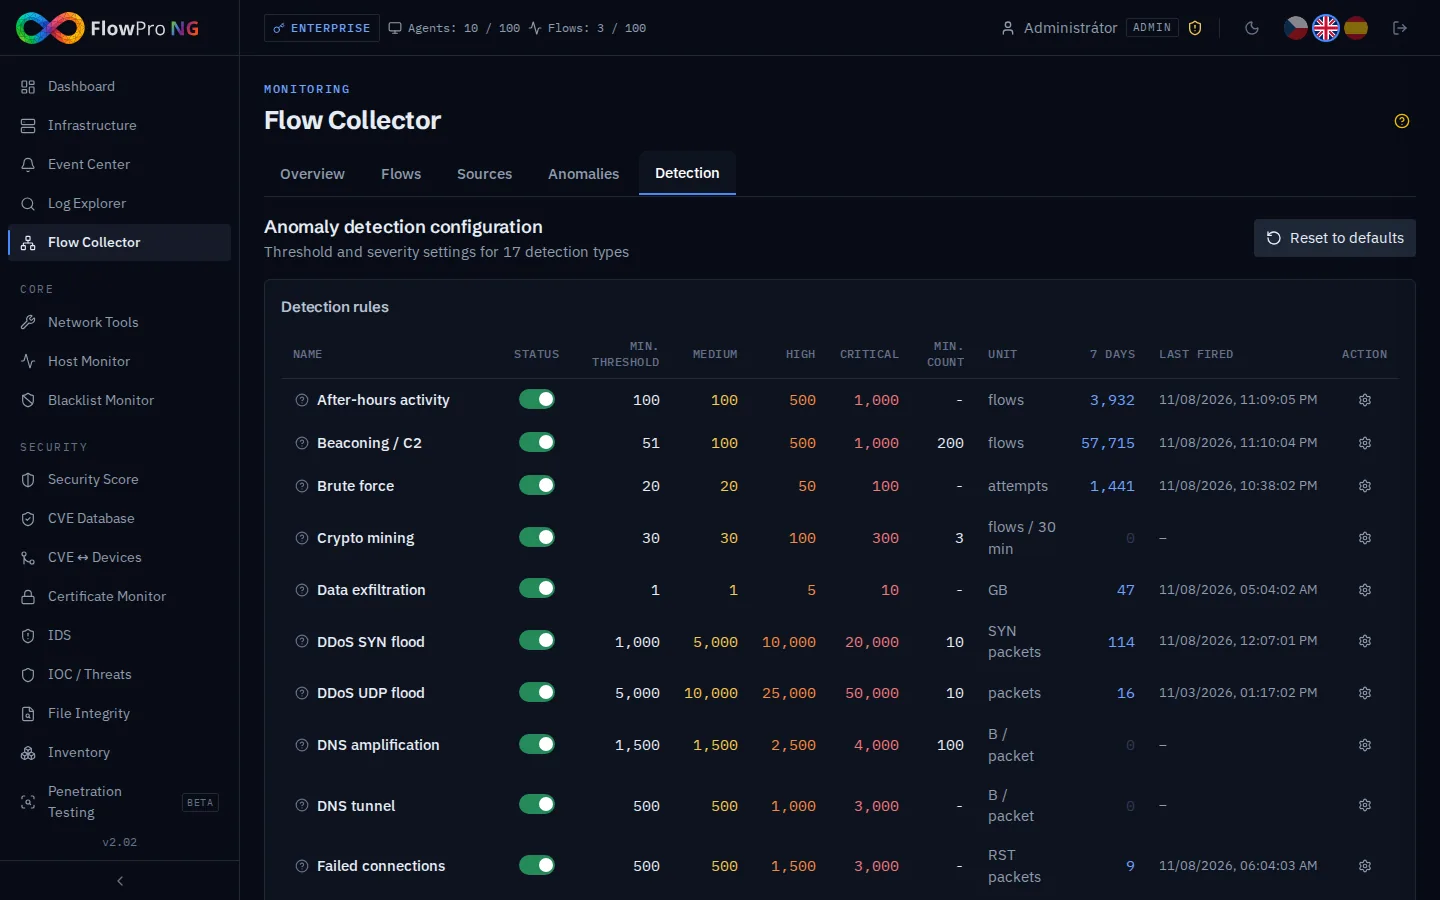
On the same tab you enter excluded addresses, such as a NAT gateway or your own DNS resolver, which would otherwise cause false positives. Anomalies of high severity and above become events in the Event Center and go on to your notification channels from there.
How long flows are kept is set in Settings → Databases → Data Retention. The upper limit comes from the license: 30 days in the free version, 6 months in Core, one year in Security and unlimited in Enterprise.
There is more on what flows are good for in NetFlow analysis and Network anomaly detection. The overall design of FlowPro NG is described in the article How FlowPro NG Works. Flow collection is part of the free version too, so you can try it right away. See the Free trial page for the steps.
- NetFlow
- IPFIX
- MikroTik
- Linux
- softflowd