Contents
Routers, switches, firewalls and access points keep a running record of what happens on them: who logged in, which connection the firewall dropped, which interface went down or who changed the configuration. On the device itself these records do not last long, space is limited and they are often gone after a reboot. That is why devices send them over the network to a central server using the syslog protocol.
This guide shows how to send syslog to FlowPro NG from the most common devices and what happens to the logs next: how FlowPro NG parses them, how to search them and how they turn into alerts.
How Syslog Collection Works
FlowPro NG receives syslog on UDP port 514. It takes each message apart: from the header it reads the severity (from "emergency" to "debug"), the category (facility), the time and the device name, and it stores the rest as the message text. It handles the classic BSD syslog format (RFC 3164) best, and practically every device supports it. Messages in another format, such as RFC 5424, are stored too and can be searched, just without a recognized severity.
For known message types the parsing goes further and FlowPro NG pulls the individual details out of the text:
- logins and logouts, including failed attempts: the user, address and access method (WinBox, SSH, web, API),
- firewall logs from MikroTik and in iptables format (Linux, UniFi): addresses, ports, protocol, interfaces, NAT and whether the connection was allowed or dropped,
- configuration changes, changes to users and firewall rules,
- VPN events (WireGuard, OpenVPN), DHCP, interface state changes, OSPF and device reboots.
Public addresses also get a country and city. The logs then live in Elasticsearch, where they can be searched quickly even across millions of records.
Before You Start
Network. Any firewall between the device and the server must allow UDP to port 514 towards the server. Syslog is sent unencrypted, so route it over your internal network or a VPN.
License. Each device that sends syslog counts as an agent. The free version allows 5 agents, Core 50, Security 200 and Enterprise an unlimited number.
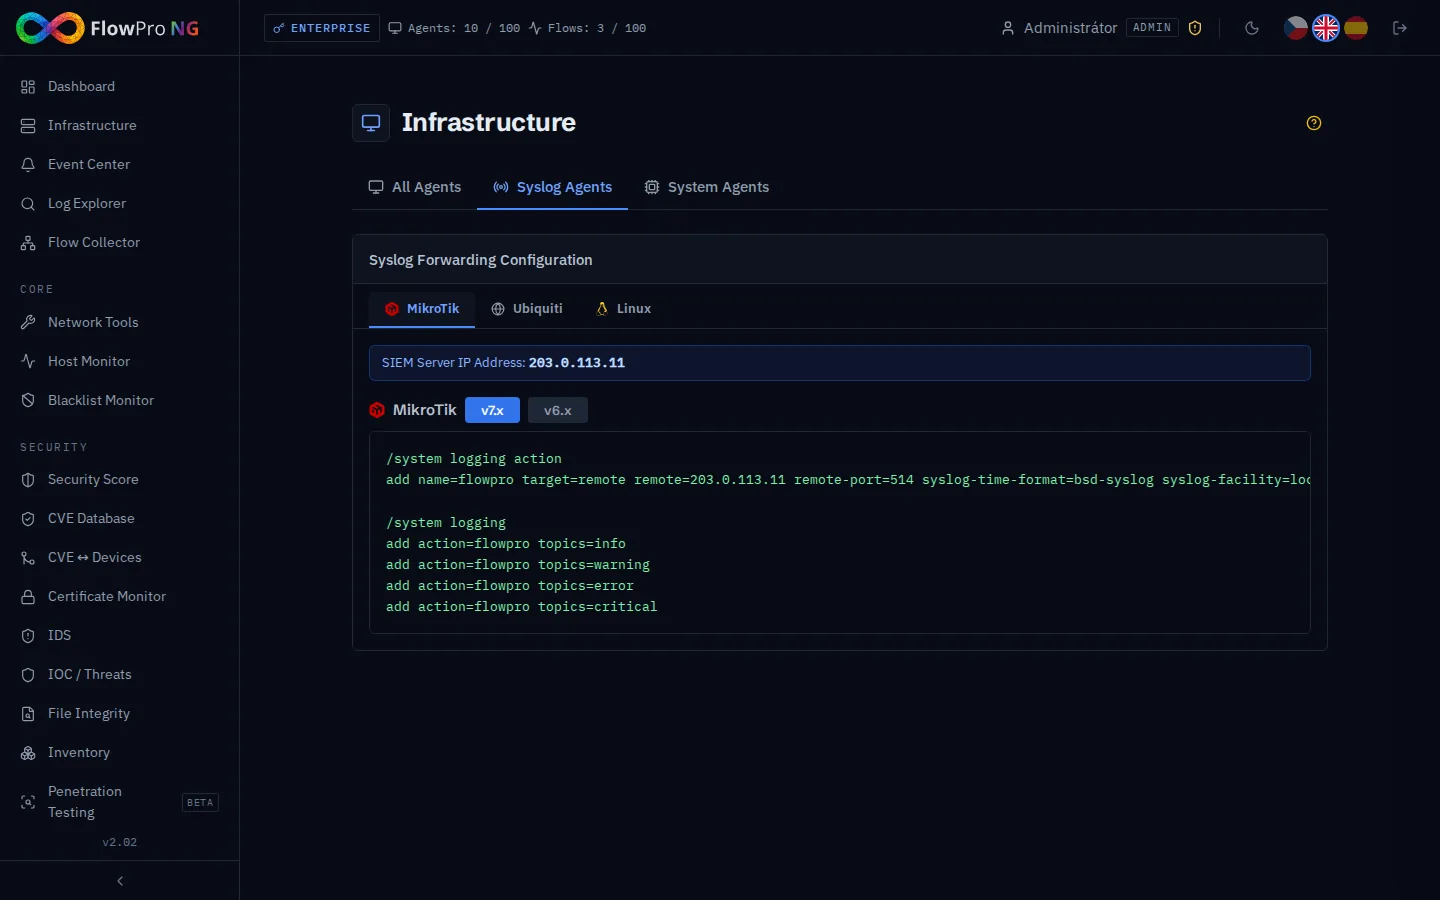
In the examples below the FlowPro NG server address is 192.0.2.10. Replace it with your own. FlowPro NG also has ready-made configuration with your server's address filled in under Infrastructure → Syslog Agents, with tabs for MikroTik, Ubiquiti and Linux.
MikroTik (RouterOS)
In RouterOS you first create a target (logging action) for the messages and then choose which messages go to it. For RouterOS v7:
/system logging action
add name=flowpro target=remote remote=192.0.2.10 remote-port=514 syslog-time-format=bsd-syslog syslog-facility=local0

/system logging
add action=flowpro topics=info
add action=flowpro topics=warning
add action=flowpro topics=error
add action=flowpro topics=critical
In RouterOS v6, use bsd-syslog=yes instead of syslog-time-format=bsd-syslog. /system logging print where action=flowpro shows the settings.
This variant sends all messages of severity "info" and above. If you only want certain areas, use categories instead of severities, for example topics=system, topics=firewall, topics=interface or topics=wireguard. Do not combine the two. Every message has both a category and a severity, so it would arrive twice.
Ubiquiti UniFi
In the UniFi Network application, open Settings → System → Advanced and turn on Remote Syslog Server. Enter the FlowPro NG server address as the host, port 514 and the Normal log level, or Verbose for more detail. A UniFi gateway sends firewall logs in iptables format, so FlowPro NG recognizes the addresses, ports and whether a rule blocked the connection. If IDS or IPS is turned on in Settings → Security → Threat Management, its alerts arrive the same way.
Linux
On a Linux server it is enough to forward logs from rsyslog, which is the default on Ubuntu and Debian. Create the file /etc/rsyslog.d/90-flowpro.conf with one line and restart the service:
*.* @192.0.2.10:514sudo systemctl restart rsyslogA single @ means UDP. For syslog-ng you will find a ready-made configuration on the Linux tab in Infrastructure.
Other Devices
The vast majority of network devices support syslog, from Cisco and HPE switches to firewalls, Wi-Fi controllers, NAS devices and UPS units. The steps are always the same: in the device settings, find remote syslog (syslog server, log server), enter the FlowPro NG address and port 514/UDP and, if there is a choice, the BSD or RFC 3164 format. The messages are stored and can be searched and filtered by device and severity.
Checking in Infrastructure
A device that starts sending logs appears in Infrastructure within moments, in yellow as new at first. One click adds it to your inventory, where you name it and set its criticality. Infrastructure then shows the status of each device and the number of events in the last 24 hours. A device that goes silent changes status, so you see right away that its logs have stopped coming.
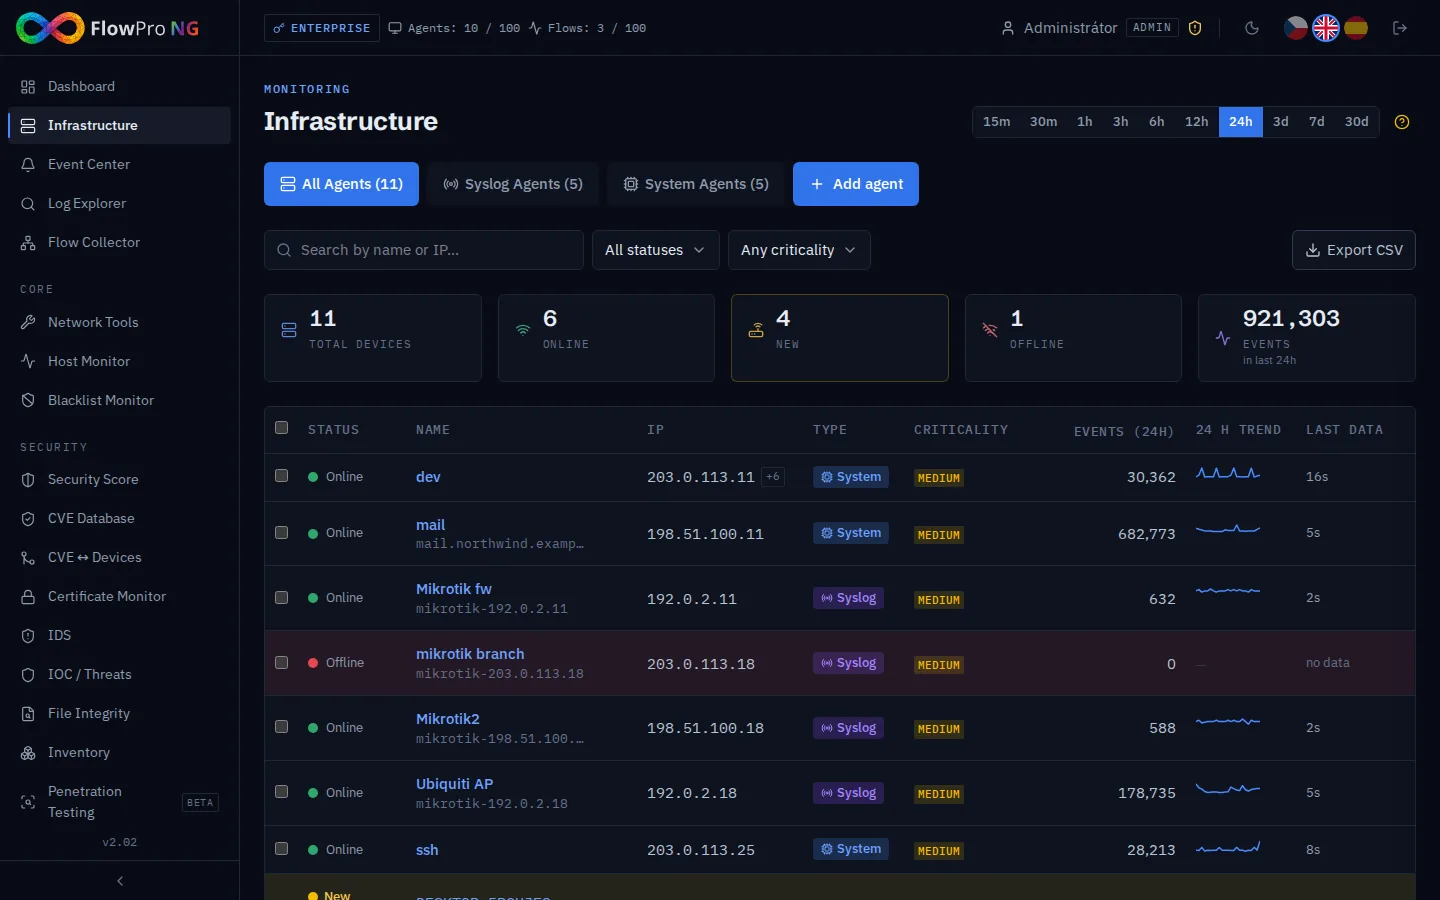
If the device does not appear, check on the server that the messages arrive at all: sudo tcpdump -ni any udp port 514 -c 10. If nothing comes in, look for the problem on the way, typically a firewall or a wrong address.
Searching the Logs
You search all logs in the Log Explorer. Queries work like a search engine: either plain text or field:value combined with AND, OR and NOT. The query event.dataset:mikrotik.syslog filters logs from network devices, all of them, not just MikroTik. Above the results is a chart of events over time, and on the left are fields you can click to narrow the result. The Live tail button shows new messages as they arrive, and results can be exported.
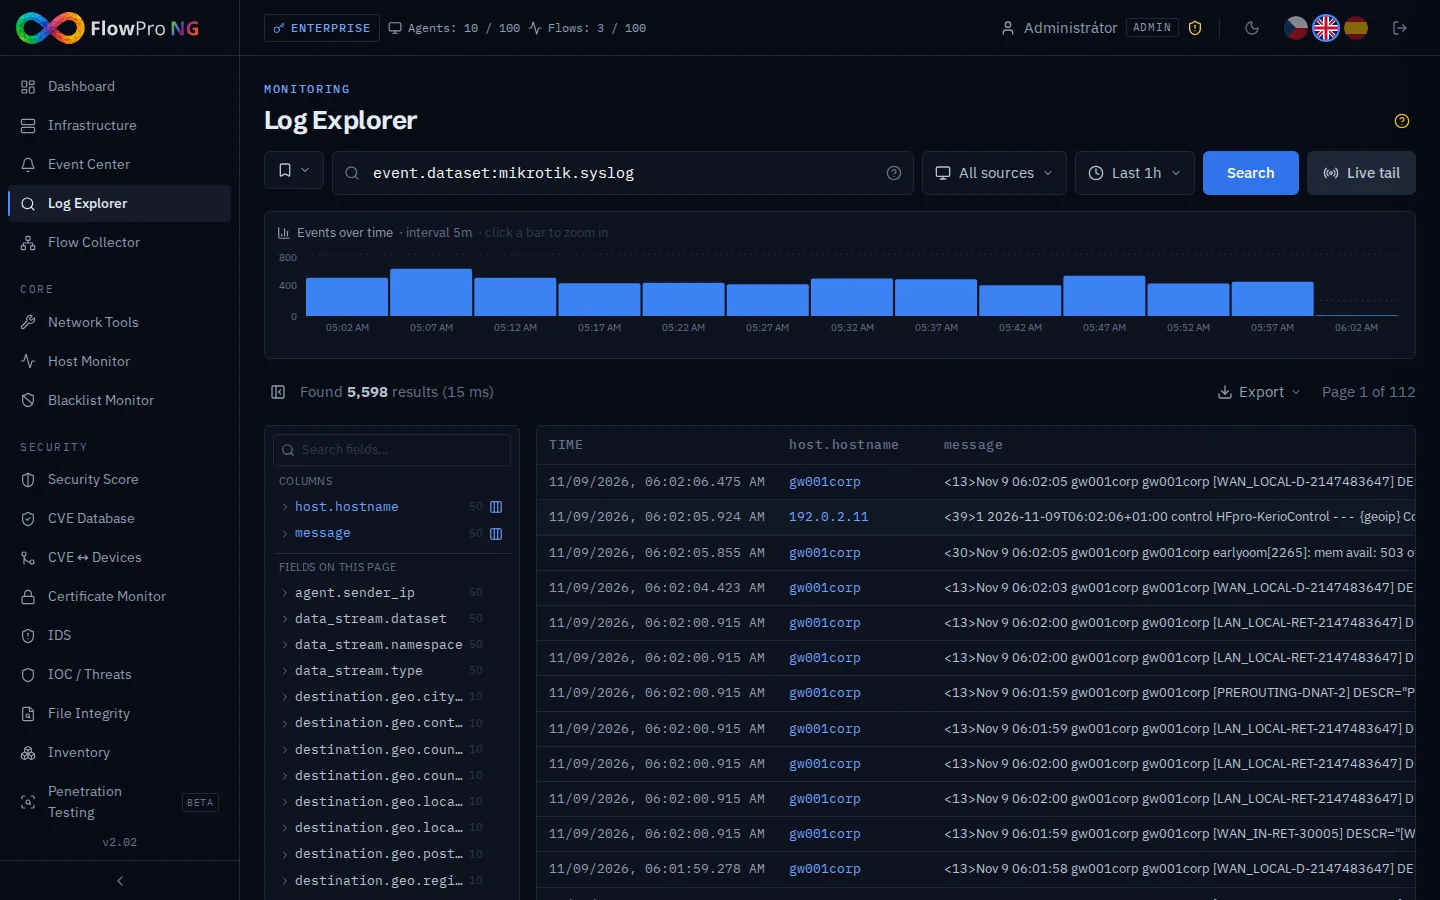
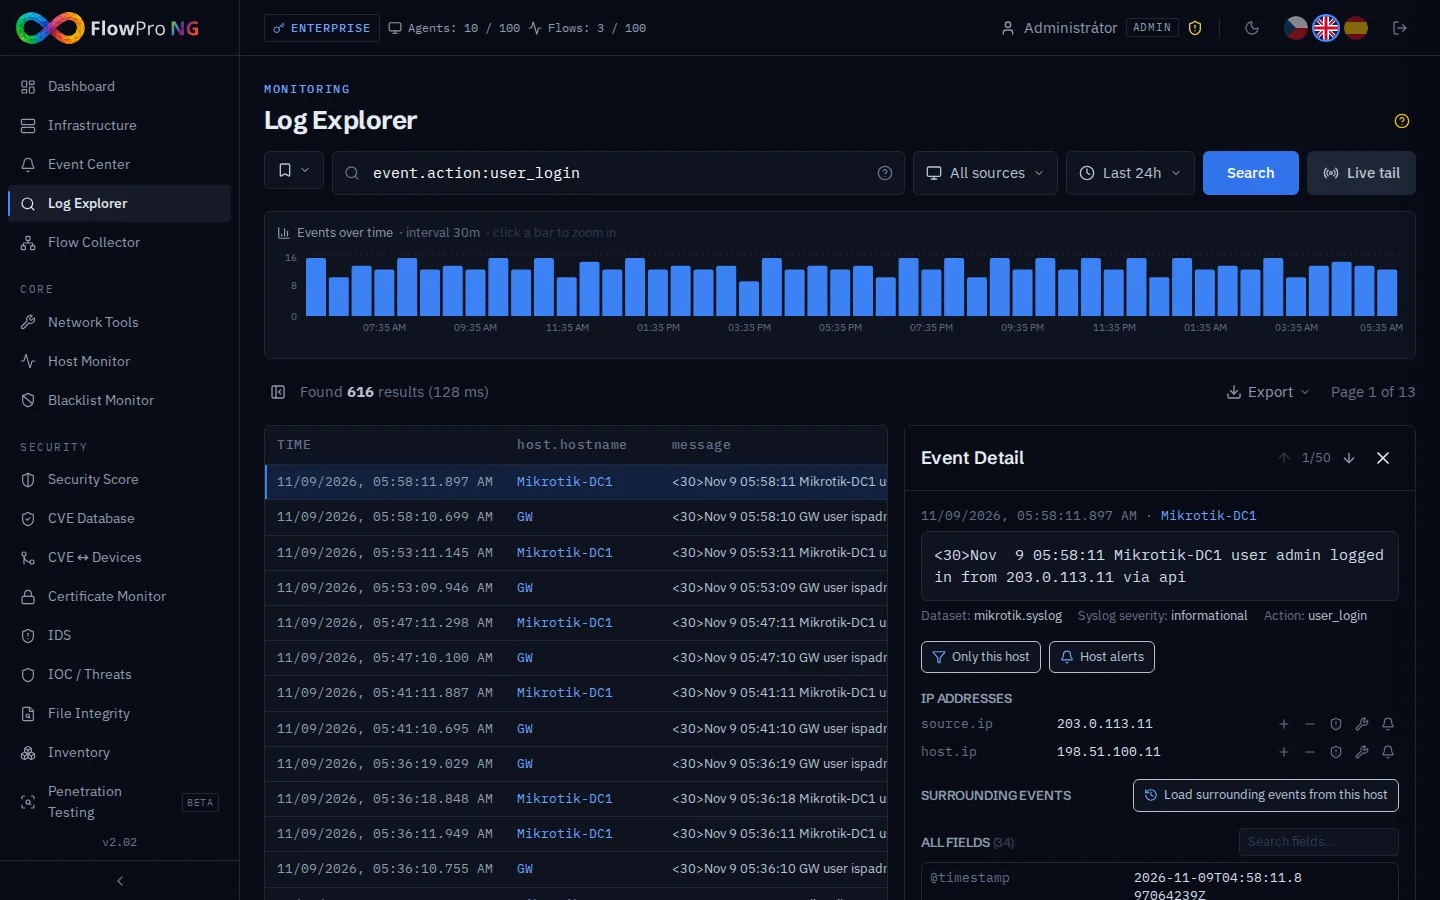
Recognized messages have their own fields. To see logins to routers, use event.action:user_login; for failed attempts, event.action:user_login_failure; and for dropped connections, event.action:firewall_log AND mikrotik.firewall.action:drop. The event detail shows the original message, the severity, the recognized addresses and all fields. From there, one click shows only that device's events, its alerts or the surrounding events from the same time.
Evaluation: From Log to Alert
Searching the logs helps once you know what you are looking for. For FlowPro NG to warn you about a problem on its own, detection rules run over the logs. Each rule is a query that runs at regular intervals, typically every 5 minutes. When it finds matching messages, it creates an alert with a severity and a link to the logs that triggered it.
You will find the rules in Settings → Detection & alerts → Detection Rules. On the Categories tab they are grouped by data source, and each category shows whether you have data for it. Syslog data belongs to the Network Devices (Syslog) category. The Enable with data button turns on every category you have data for and turns off the ones you do not.
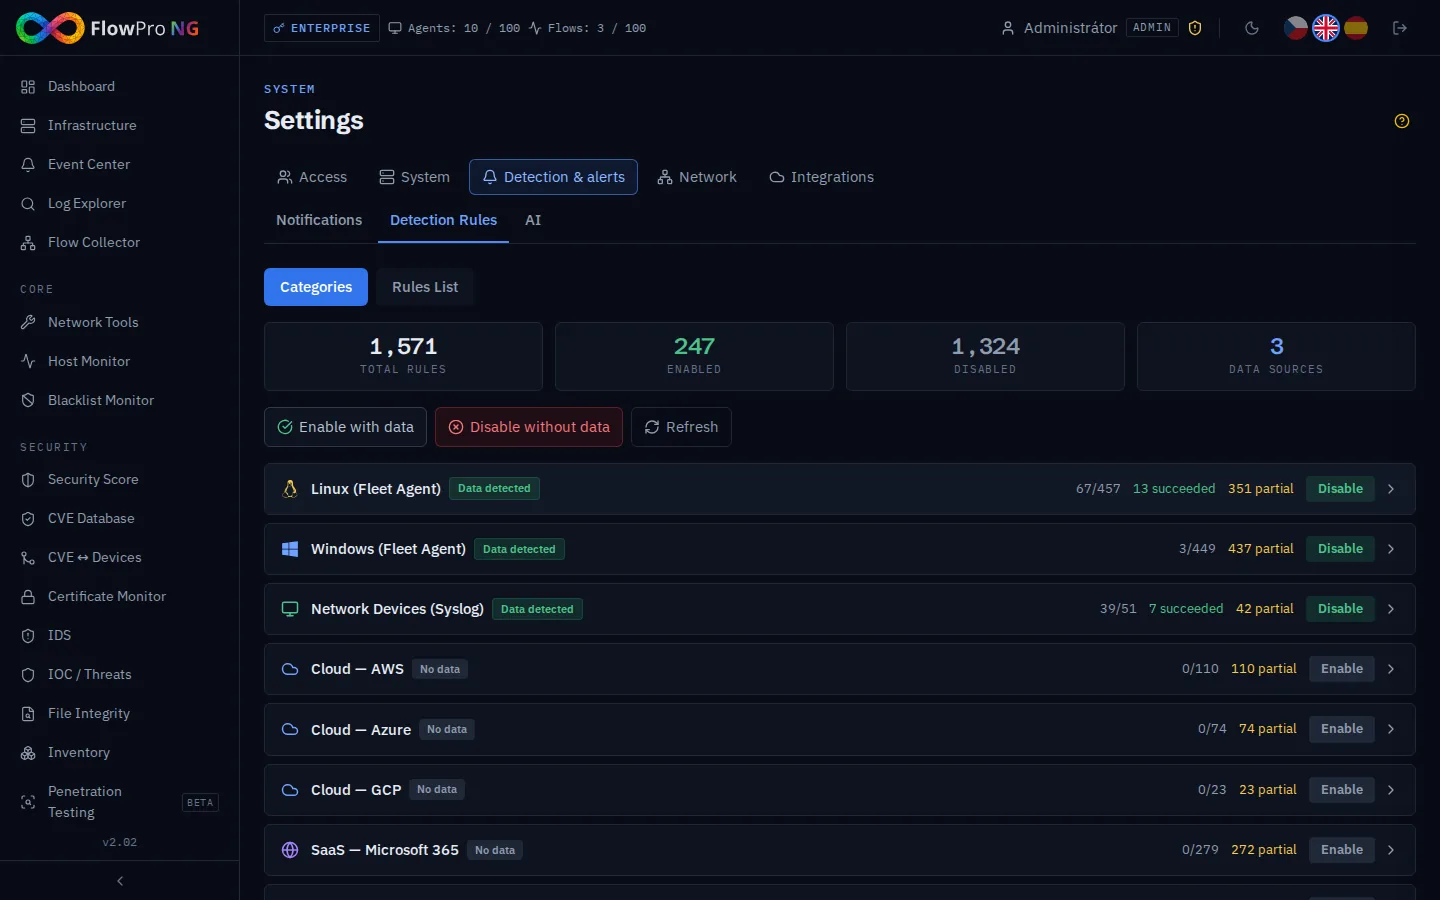
For MikroTik there is a ready-made rule pack that watches for:
- a failed login to the router,
- a brute-force attack, meaning 5 or more failed logins from one address within a few minutes (critical severity),
- a user account change,
- a firewall rule change,
- a router reboot.
On the Rules List tab you can also write your own rule. You enter a name, a query in the same syntax as in the Log Explorer, a severity and how often it should run. You can then link the rule directly to a notification channel. A typical custom rule watches for logins to a router from outside, or for a specific error message that preceded an outage in the past.
With the Security license, FlowPro NG also compares the addresses in firewall logs with lists of known malicious addresses. When an internal device communicates with an address from such a list, it shows up as an event of the IOC / Threats module.
Event Center and Notifications
Alerts from rules end up in the Event Center together with events from all other modules. The Syslog source filter shows only those that came from network device logs. Repeated alerts from the same rule are grouped into one row with the number of occurrences. You can acknowledge, close or comment on each one, or mark it as a false positive.
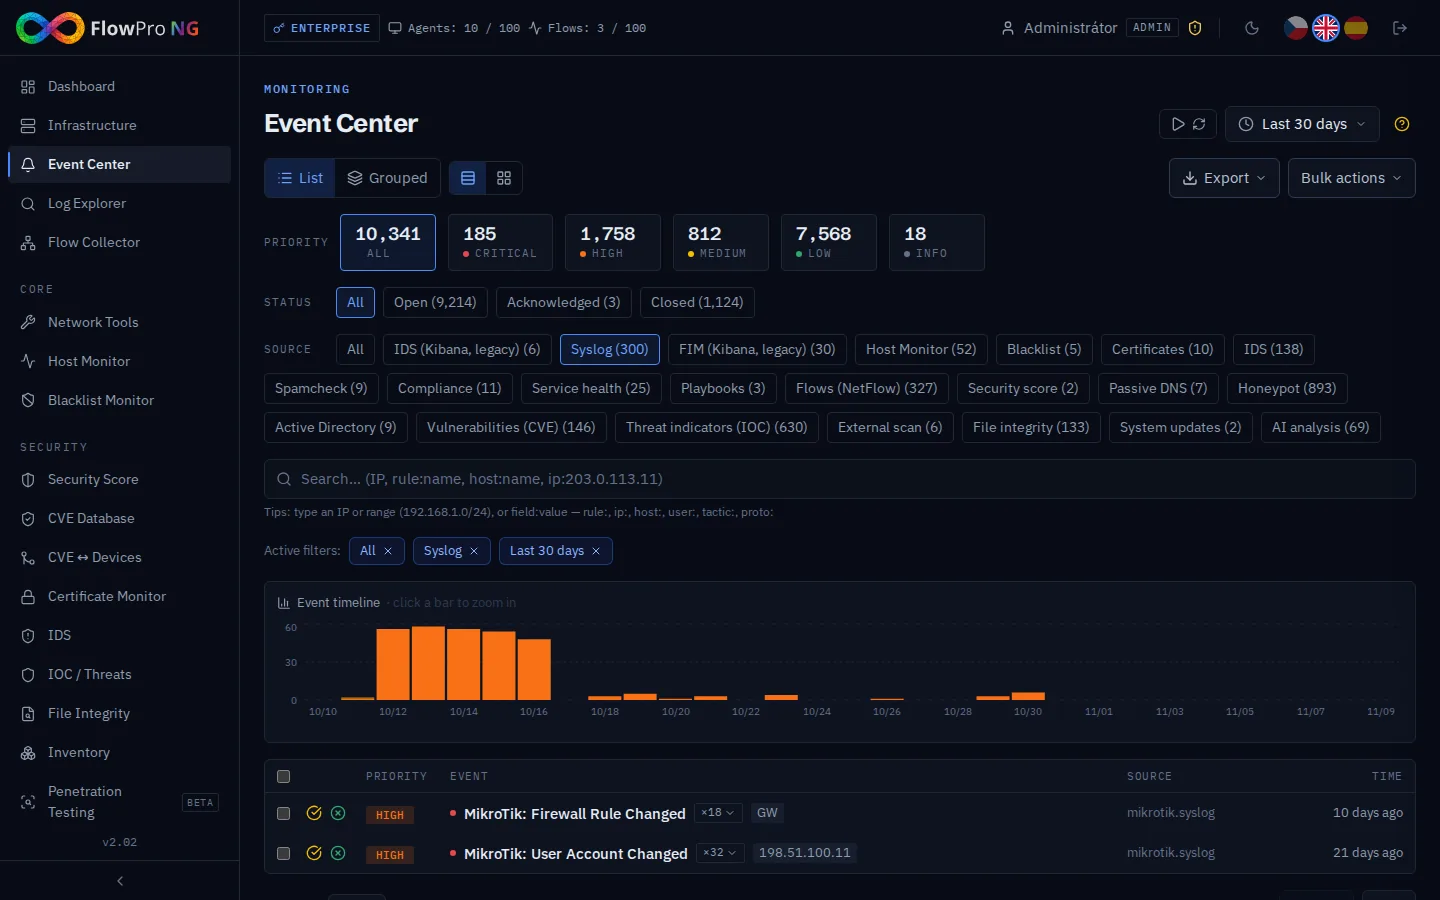
So that nothing important slips past you, set up a channel in Settings → Detection & alerts → Notifications (e-mail, Telegram, Slack, Microsoft Teams, ntfy or a webhook) and a routing rule that sends it, for example, high and critical events from syslog.
How Long Logs Are Kept
Logs from network devices have their own Network Devices category in Settings → System → Databases → Data Retention. The default is 14 days, because firewall logs in particular grow fast. You can extend it up to the limit of your license: 30 days in the free version, 6 months in Core, one year in Security and unlimited in Enterprise. If you keep logs because of NIS2 or internal policy, set a longer period and plan for the disk space. Each category shows how much space it currently takes.
The overall design of FlowPro NG is described in the article How FlowPro NG Works, and flow collection in the guide Collecting NetFlow. There is more on collecting and evaluating logs on the SIEM and log management page. Syslog collection is part of the free version too, so you can try it right away. See the Free trial page for the steps.
- Syslog
- MikroTik
- UniFi
- Linux
- Detekční pravidla