Contents
Network devices send their logs over syslog because you cannot install anything else on them. On servers and workstations you can, so there FlowPro NG uses Elastic Agent. The agent collects both logs and performance metrics, sends them encrypted, and its settings are changed centrally from FlowPro NG, so you never have to visit a machine to change them.
This guide shows how to deploy the agent on Linux and Windows, what it collects, how to adjust collection and what FlowPro NG does with the data next.
How the Agent Works
The FlowPro NG server runs a Fleet Server that manages the agents. During installation the agent enrolls, downloads its policy (the list of what to collect) and starts sending data to Elasticsearch on the FlowPro NG server. When you change the policy, the agents pick it up on their own within moments.
The default policy collects:
- on Linux, login and security logs (
/var/log/auth.log,/var/log/secure), system logs (/var/log/syslog,/var/log/messages) and the systemd journal, - on Windows, the Application, Security and System event logs, which cover logons, account lockouts, changes to users and groups and service installations among other things,
- on both systems, metrics: CPU, memory, disk and network usage, load, disk I/O, file systems, processes and uptime.
Each machine with an agent counts towards the agent limit of your license: 5 in the free version, 50 in Core, 200 in Security and unlimited in Enterprise.
Before You Start
- The machine must be able to reach the FlowPro NG server on TCP port 8220 (Fleet Server) and 443 (to download the installation script).
- The agent package is downloaded from
artifacts.elastic.co, so the machine needs internet access during installation. - Installation requires administrator rights:
sudoon Linux, PowerShell run as administrator on Windows.
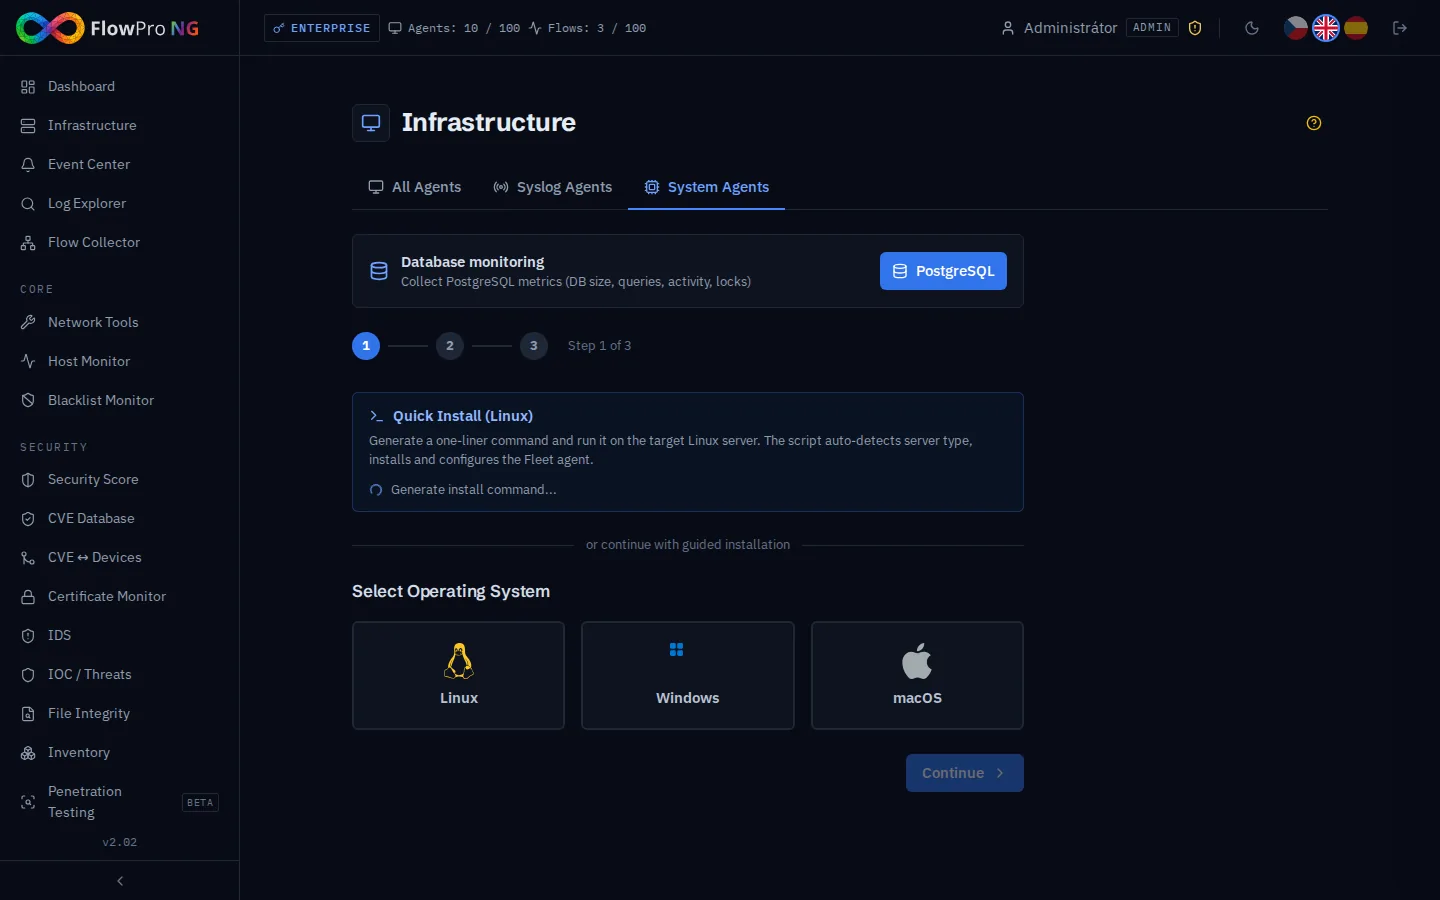
You start the installation in Infrastructure → System Agents. For Linux there is a one-line command; for Windows and macOS there is a step-by-step wizard.
Linux: Installation With One Command
In the Quick Install section, FlowPro NG generates a command that you copy and run on the target server. It looks roughly like this:
curl -fsSL https://flowpro.example.com/api/v1/fleet/install.sh -H "X-Install-Token: …" -o /tmp/flowpro-install.sh && sudo bash /tmp/flowpro-install.sh ; rm -f /tmp/flowpro-install.shThe token in the command is valid for one hour; after that, generate a new one. The script checks the system (architecture, memory, disk space and the connection to the server) and whether an agent is already installed. Based on the running services it suggests a server type: web (Nginx, Apache), mail (Postfix, Dovecot) or general. Once you confirm, it downloads the agent, installs it as a systemd service and enrolls it. The whole thing takes a few minutes.
The script asks questions in a text menu, so run it in a normal terminal or over SSH, not from automation without a terminal.
Windows: Installation With PowerShell
For Windows, choose Windows and an agent type in the wizard. FlowPro NG then shows the commands with the server address and enrollment token already filled in. Open PowerShell as administrator and paste the commands. The wizard generates them in this form:
Invoke-WebRequest -Uri "https://artifacts.elastic.co/downloads/beats/elastic-agent/elastic-agent-8.19.11-windows-x86_64.zip" -OutFile elastic-agent.zip
Expand-Archive .\elastic-agent.zip -DestinationPath .
cd elastic-agent-8.19.11-windows-x86_64
.\elastic-agent.exe install --url=https://192.0.2.10:8220 --enrollment-token=… --insecure --non-interactive
The agent installs as a Windows service and checks in within a minute. The --insecure parameter is there because the Fleet Server on the FlowPro NG server uses its own certificate.
Checking in Infrastructure
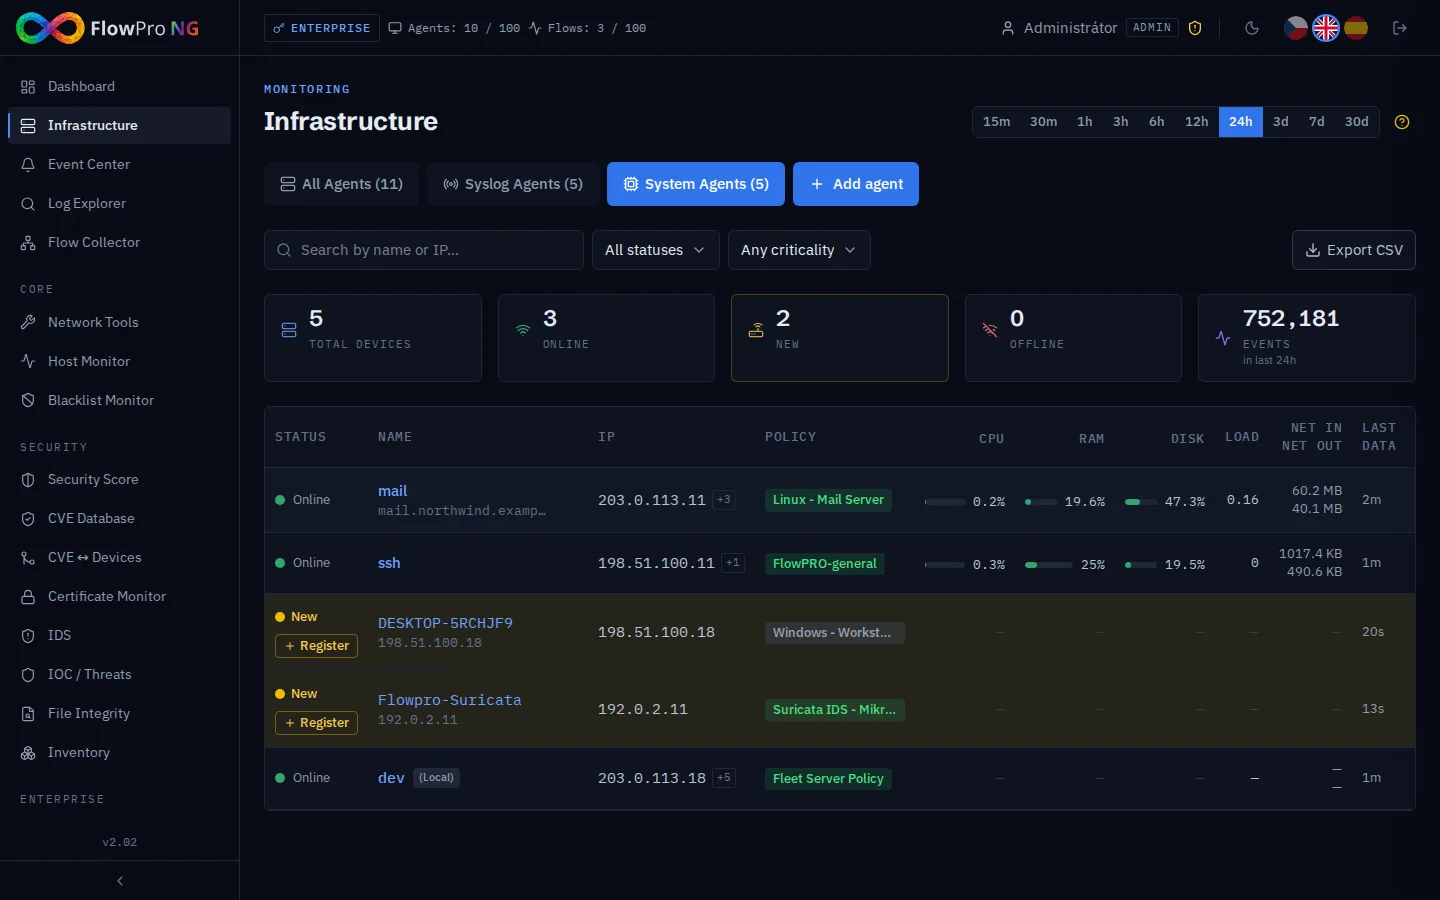
Within a minute, the new agent appears in Infrastructure on the System Agents tab, in yellow as new at first. The Register button adds it to your inventory, where you name it and set its criticality. The table then shows the status, policy, current CPU, memory and disk usage, load, network traffic and when the agent last sent data.
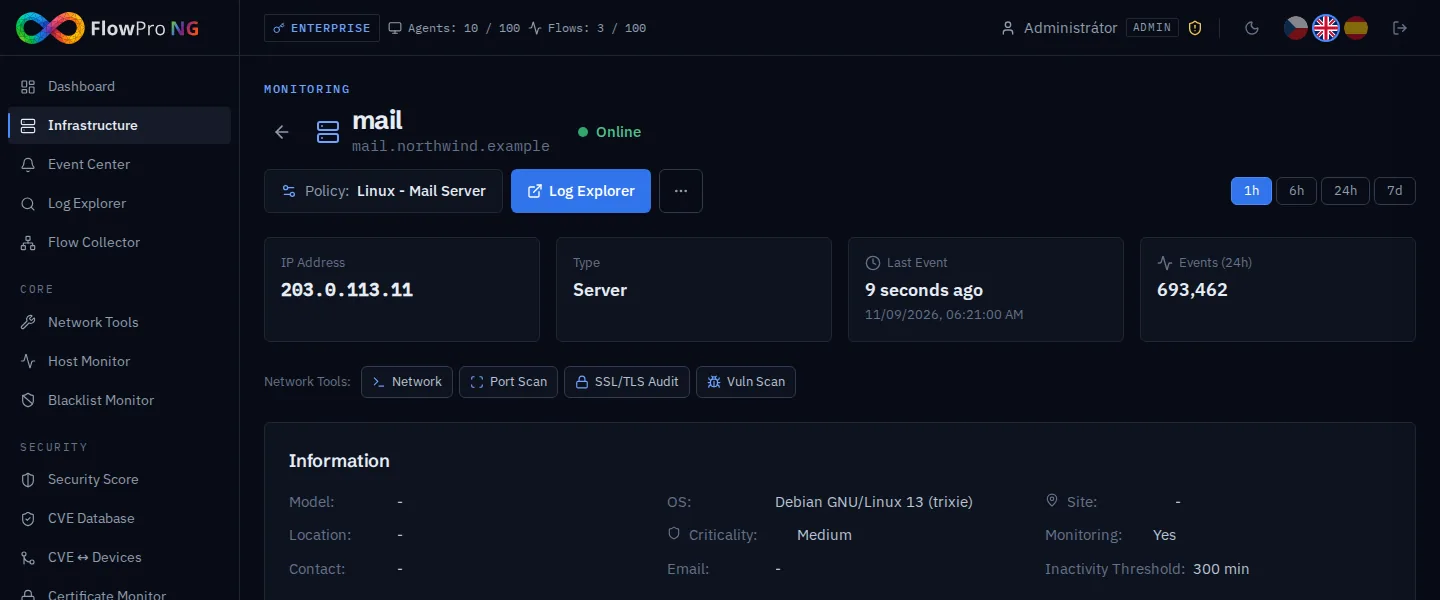
Click an agent to open its detail with system information (operating system, kernel, CPUs, memory, uptime), metric charts and an overview of events. One button takes you from the detail to the Log Explorer, filtered to that machine.
Policies: What Exactly Is Collected
What an agent collects is set by the policy it belongs to. During installation FlowPro NG prepares several policies: general ones, ones for web and mail servers, and separate policies for Linux servers, Proxmox and Windows workstations and servers. The Windows policies also include the Windows integration with PowerShell and Sysmon logs and performance counters. You move an agent to another policy with Change policy in its detail.
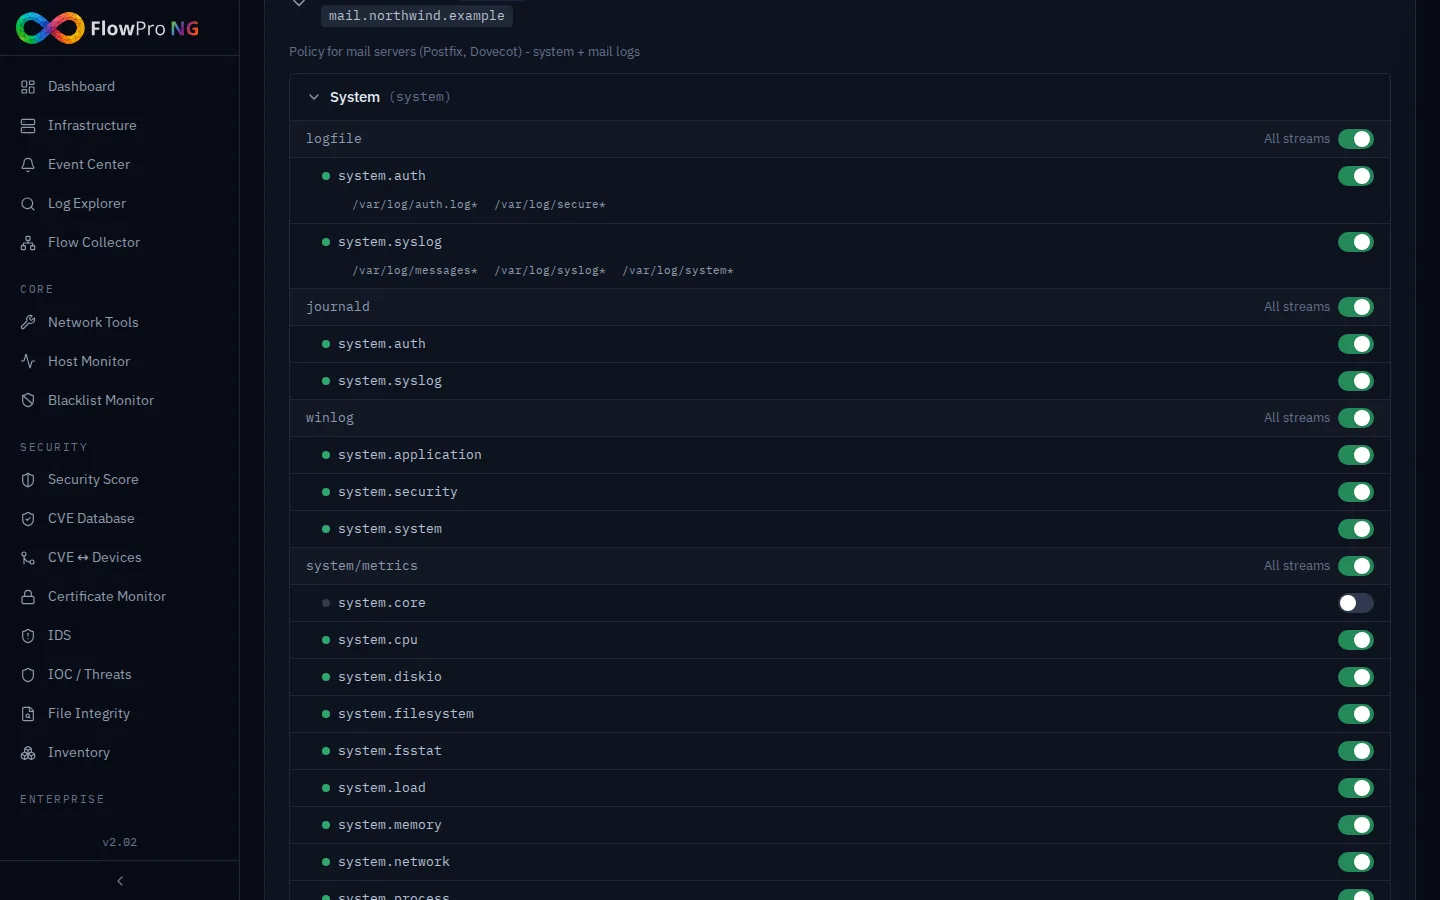
You turn individual data streams on or off in Settings → Integrations → Agent Policy. For each policy you see which integrations it contains, which files and logs it reads and which metrics it collects. A change applies to every agent in that policy and is recorded in the change history.
FlowPro NG adds some integrations on its own. When it finds an IIS web server running on a Windows server, it adds IIS log and metric collection to that server's policy.
Searching the Logs
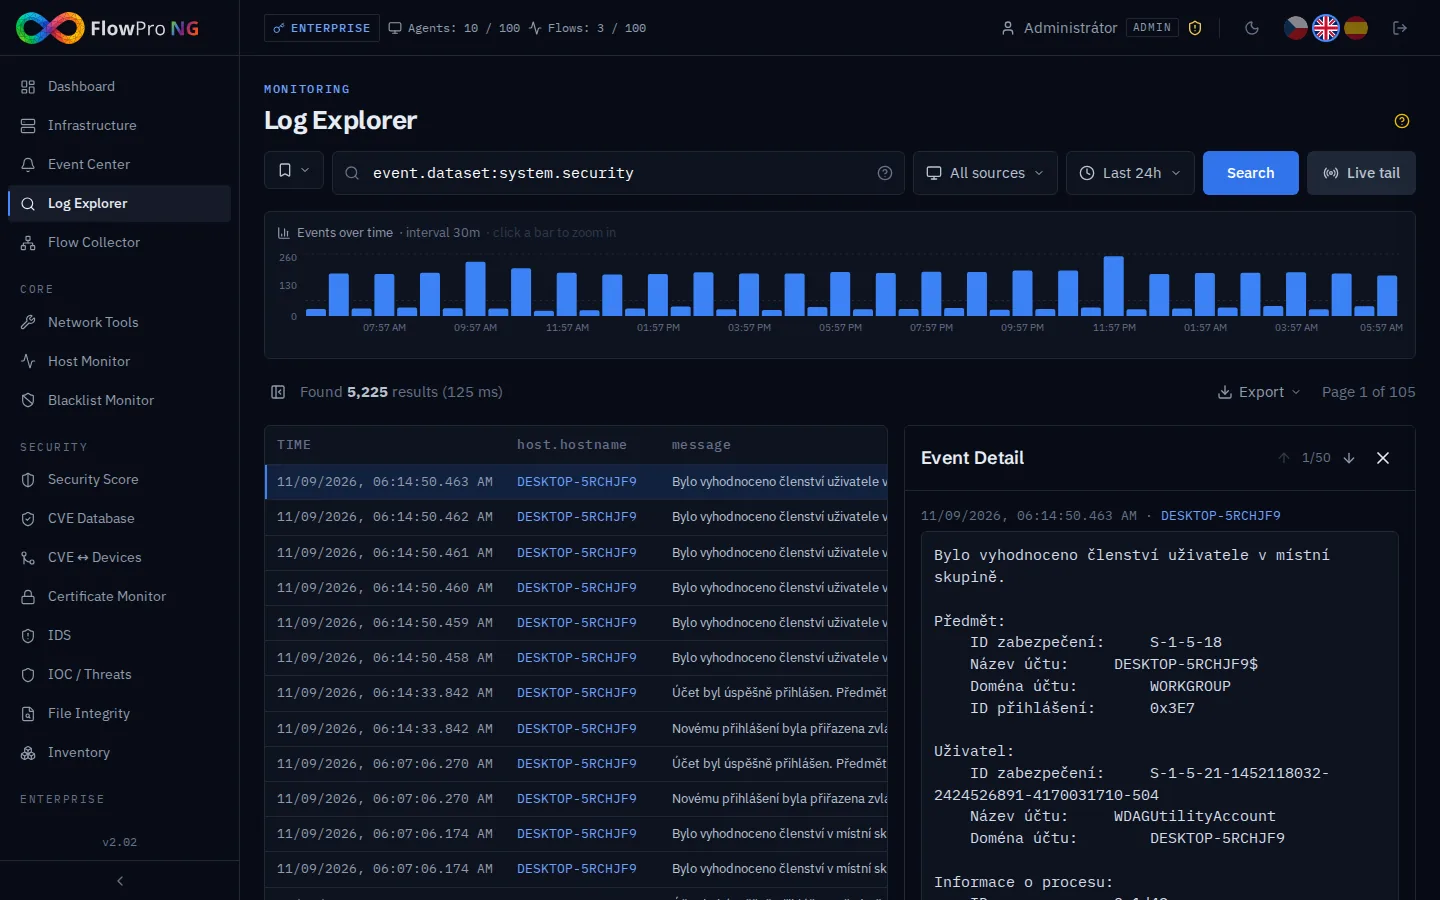
Agent logs are in the Log Explorer along with all the others. The event.dataset field tells the kinds of logs apart:
system.auth: Linux logins, SSH, sudo and user changes,system.syslog: Linux system logs,system.security: the Windows Security log,system.systemandsystem.application: the Windows System and Application logs.
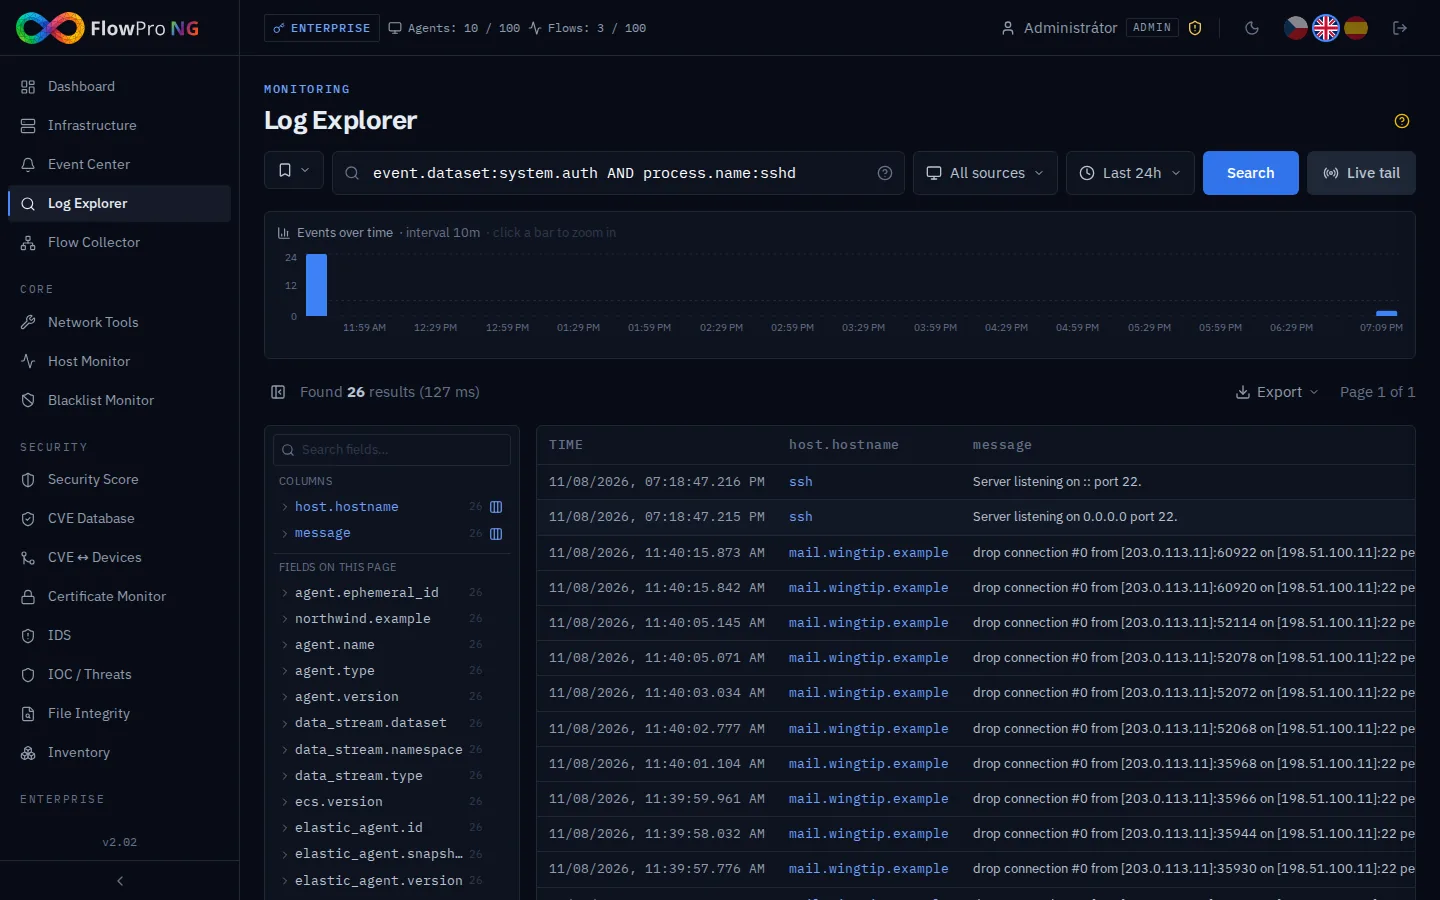
For example, the query event.dataset:system.auth AND process.name:sshd lists all SSH service messages from all Linux servers. They also show when sshd drops connections from an address that keeps trying to log in.
Windows stores messages in the system language, so on a Czech installation they are in Czech. The event detail shows the whole message, including the account, domain and logon ID.
Evaluation: Rules and Alerts
Detection rules run over agent data in Settings → Detection & alerts → Detection Rules. On the Categories tab there are two groups for agents: Linux (Fleet Agent) and Windows (Fleet Agent). Each contains hundreds of ready-made Elastic rules, for example for SSH logins from an unusual address or with an unusual key, the creation of a new user or group, changes that give an attacker persistent access, or suspicious process execution. The Enable with data button turns on the categories you have data for.
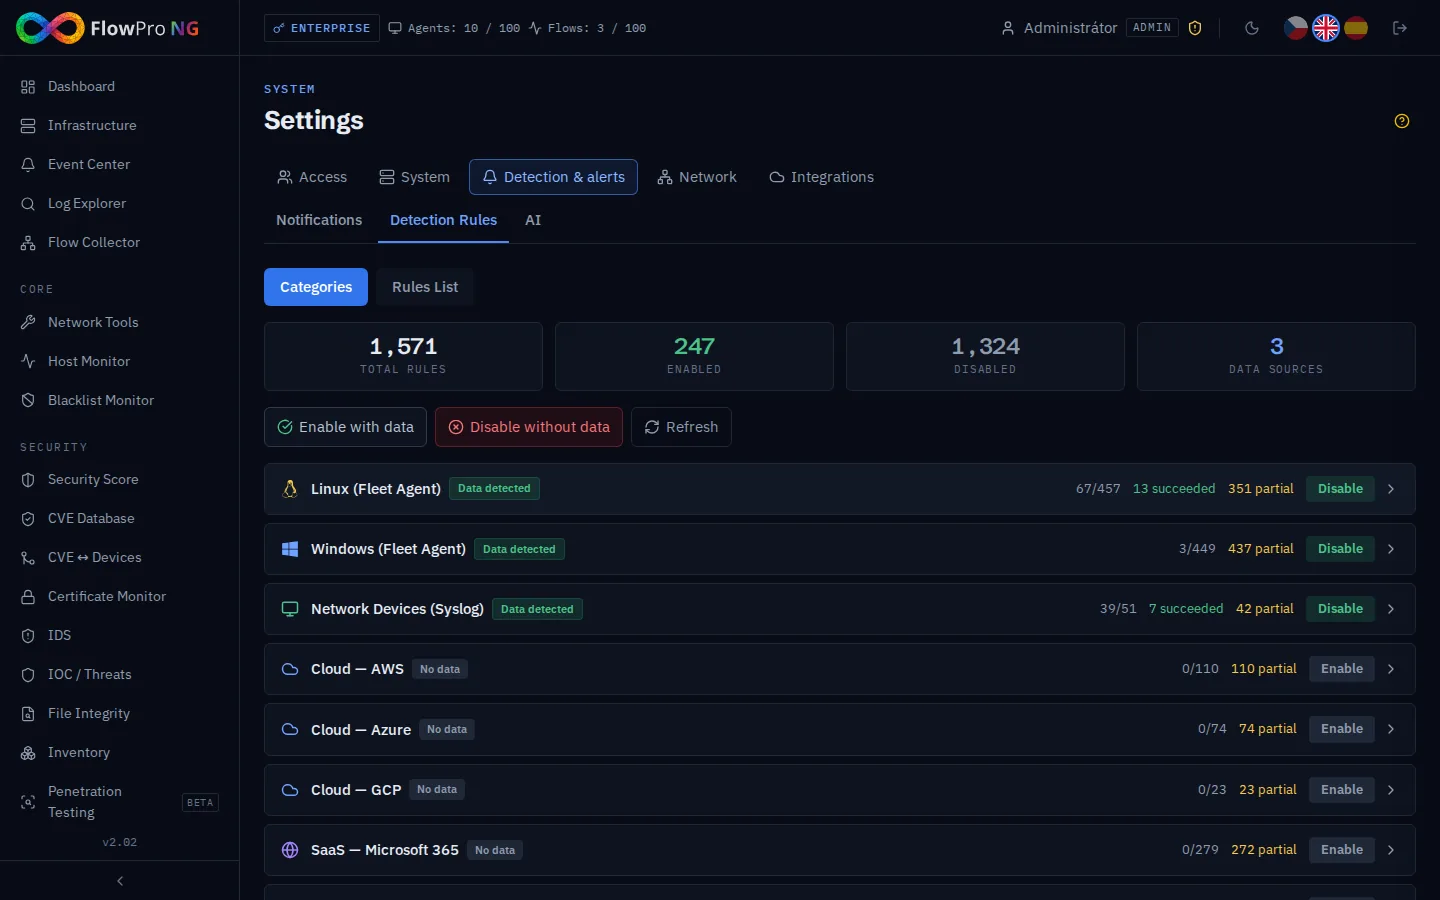
Some Windows rules need additional sources, such as Sysmon or PowerShell logs. Those are collected by the policies for Windows workstations and servers. You write your own rule on the Rules List tab, using the same query as in the Log Explorer.
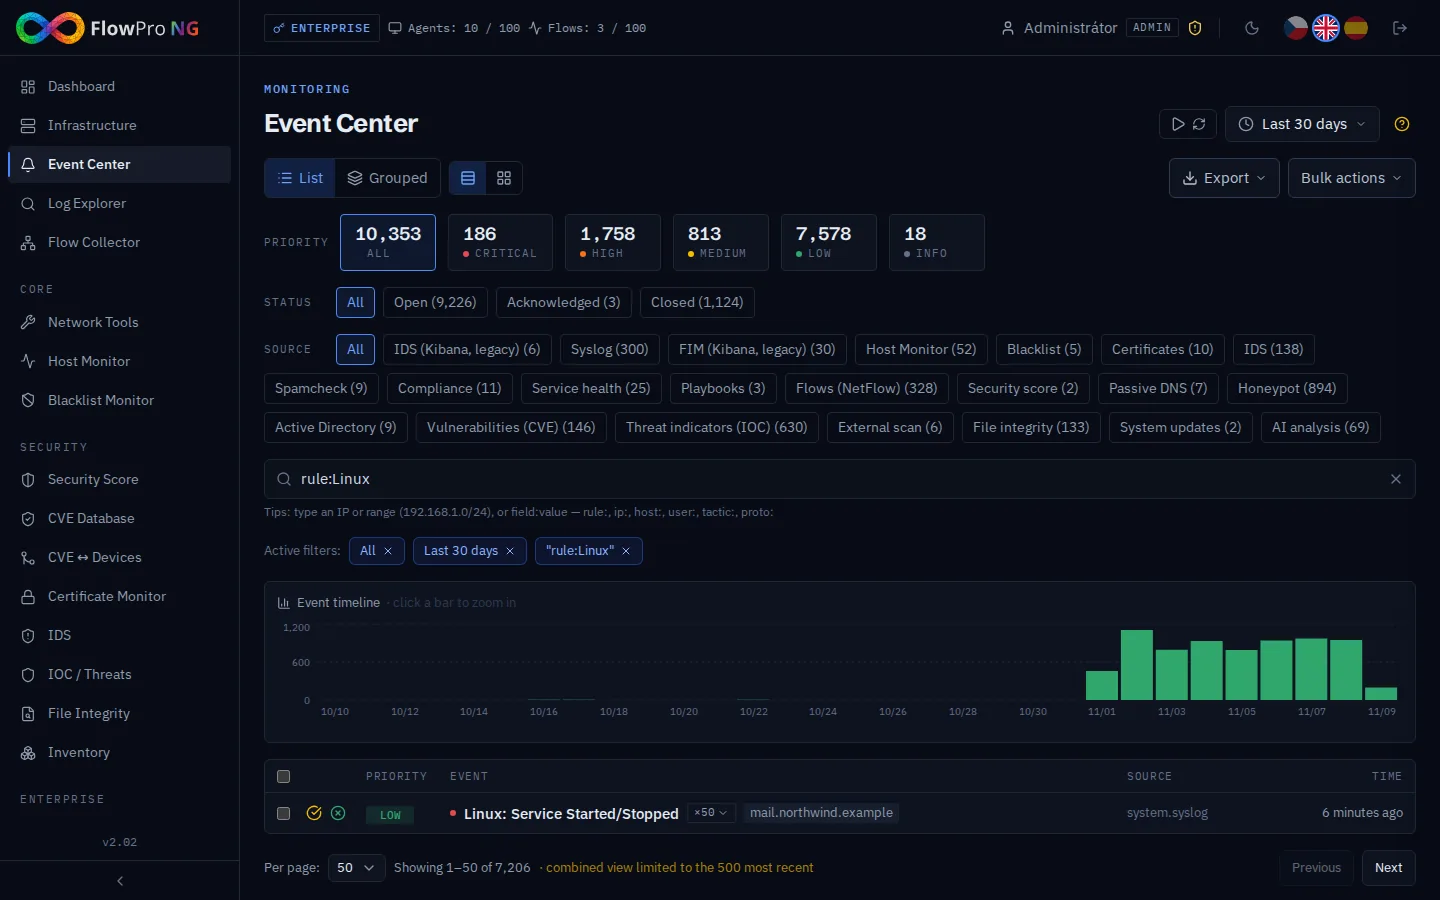
Alerts from rules appear in the Event Center. From there you acknowledge, close or mark them as false positives, and notifications deliver them by e-mail or to a chat.
Uninstalling
To uninstall the agent, run sudo elastic-agent uninstall on Linux, or on Windows run & 'C:\Program Files\Elastic\Agent\elastic-agent.exe' uninstall -f in PowerShell as administrator. The agent unenrolls itself during uninstallation and frees its place in the license.
How data from agents, syslog and NetFlow fits together is described in the article How FlowPro NG Works. For network devices there is the guide Collecting Syslog, and for network flows Collecting NetFlow. There is more on log evaluation on the SIEM and log management page. You can try agents in the free version too. See the Free trial page for the steps.
- Elastic Agent
- Linux
- Windows
- Fleet
- Detekční pravidla